Hello all,
There is lots of talk about the specific pattern that is used for villagers on mystery islands. I would like to present my findings in this document regarding the data I collected on my own and from other people and subsequent statistical analysis. This document is an adaptation of my original post about this on TBT.
Thanks to TBT users ForbiddenSecrets for posing the theory originally and Selkie, Sheba, Aliya, Typhloquill, sicklewillow, LtBunBuns, and nnyeon for providing data!
I intend for this document to be more easily viewed and read in the Animal Crossing community, so everyone who is curious about this can be more informed.
The very last page contains a list of the calculated probability values for finding a specific villager based on their species.
For starters, here is the TL:DR outlining my conclusions:
- The game does NOT just roll for a specific villager right off the bat.
- The game randomly rolls species first then proceeds to roll a villager in that chosen species at random.
- Each species has an equal chance of being rolled, 1/35, and there are 35 different species in this game.
- Each island is a new roll. The previous rolls do NOT affect the next roll.
- The game does NOT roll for personality on its own ever. The personality is determined when the villager is rolled, but not separately.
- Having or lacking a specific species/personality on your island does NOT increase NOR decrease your chances for that species/personality significantly.
- Time of day does NOT cause certain villagers to be more likely to appear. This seems to be a common theory being circulated around, however, this has been debunked as false by dataminers (Ninji). Date doesn’t play a role either.

And this is a dataminer (@Ninji#1624) actually confirming my theory.
And here is the more complex evidence and reasoning behind these conclusions:
The way the tests were done are pretty straightforward. People have been noticing the octopuses appearing a lot more than they should as there's only 3 of them. Therefore, I tested to see if the number of octopuses that actually appeared in the sample was statistically significant than the number of octopuses that we would expect to appear in the sample if we assumed that every single villager had the same chance to appear.
First, what is a Chi Square test?
Basically, it tests whether 2 groups of data are statistically different. A common use of it is to test whether your observed set of data is statistically different (not due to random chance) from the expected data which is exactly what I did here.
Okay thanks, so how did you use it to reach your conclusions?
Now that you know what a Chi square test is, I’ll go into how I used it to come to my conclusions. Before this theory was brought up, I performed a Chi Square test on the data to check if it was completely random or pseudo-random or if there was a pattern. The data has a sample size of 344. The expected chance of an octopus appearing using the old theory of the game randomly rolls a villager from the pool of 391 is 3/391. In the data we would expect one to have about 2.56 appearances in the 344. The data contained 12. Here is the Chi Square test for this model:
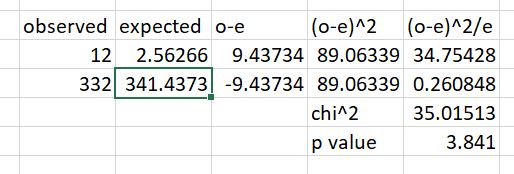
As you can see, the Chi Square value is larger (much larger) than the value that produces a p-value of 0.05 for a Chi Square test with 1 degree of freedom (the p-value that is produced with 35.01 is less than 0.00001). This concludes that the observed and expected are indeed statistically different. Therefore, the game does NOT just choose a villager at random out of the 391.
After seeing someone online bring up the thought that the game might roll species first, I decided to go back to the data and perform another Chi Square test using the parameters that the game chooses a species first at random then a villager in that species. Using this, the expected chance of an octopus is 1/35 not 3/391. In the sample of 344, we would expect the octopuses to have 9.54 appearances. Here is the new Chi Square test:
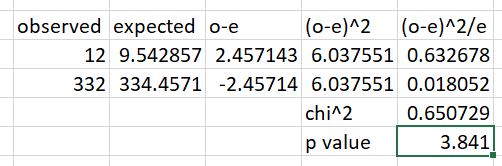
Now, the Chi Square value is less than the value that produces a p-value of 0.05 for a 1 degree of freedom test (the p-value that 0.65 produces is 0.42). This means that we cannot reject the null hypothesis of "The game randomly rolls a species of villager first" I conclude that the theory that the species is rolled first then one is selected in that chosen species is basically correct.
The following information is updates to the original version of the document based on more data collected and tests performed as well as questions asked on my original TBT post. I will continue to add to the document with new findings.
What about the different species? Did you see if the species roll first theory applies across the board?
I went back and tested ALL of the species. 33/35 of them fit the test. The ones that didn't were Dog and Ostrich with both of them being 2 appearances above the accepted range for my Chi Square test. Since the large majority (almost 95%) of species did fit the test, and it's clear that the personality roll definitely isn't a thing, I conclude that these 2 were just exceptions due to the sample data. They will eventually even out into the acceptable range as more data is collected, that's what the Law of Large Numbers states. As sample size grows, it will become more and more representative of the full population.
What about personality? Is there a personality roll too?
I did more formal testing to figure out if the game rolled personality after the species roll or not. I found out that the game does NOT roll personality at all separately.
Here is the reasoning behind this conclusion:
The tests for this were conducted by taking a look at all of the species with Uchis, and how many uchis were found in the data. I looked to see if the percentage of Uchis found in villagers with 8 personalities was 12.5% (1/8) or was it a different number. Using the Chi Square test, I discovered that the actual appearance of the uchis in these species was way under 12.5%, enough to be statistically significant by a lot. I then looked at all of the species with uchis and the Uchi appearances and compared it to the number of uchis total/number of villagers total in species with Uchis. I found that these were not statistically significant. This allows me to formally make the conclusion that the game does NOT roll for a personality at all. It just goes straight from species to villager. The last test's results are consistent with this theory, it makes sense that the percentage of Uchi appearances in species with uchi villagers is not statistically different from the percent of uchi villagers in the species with uchis.
Why did you choose Uchi to test for this?
When doing my tests to initially figure out if there was a personality roll, in theory each personality would have a 1/8 chance of appearing. 4 out of the 8 species appeared either significantly more or less than 1/8. Cranky, Normal, and Jock all appeared way more, while Uchi appeared way way way less, like half as much as it should have been appearing. Now this could have been due to the fact that not all of the species have an Uchi villager, therefore, after the species roll, sometimes there would be no way to roll an Uchi if a nonUchi species was rolled. So that's why I then just tested the data of species with at least 1 Uchi. I tested species with 7 different personalities, including Uchi, and those with all 8 separately. The 7 personality species test was within the acceptable range, however, the 8 personality species test was way out of the acceptable range, allowing me to conclude there is NOT a personality roll after the initial species one.
Why didn't you test the other personalities too?
Once I found out from the Uchi test there was no personality roll, it didn't matter for the other personalities. The Uchi test alone is enough to disprove the personality roll theory, combined with the fact that 4/8 personalities had a statistical difference in their appearance rate from the 1/8 that would've been had the personality roll been a thing.
Why did Nintendo make it this way?
These are just my thoughts on what this means, I in no way speak for Nintendo:
I would think that the mystery islands were not intended to be used hundreds and hundreds of times in search of that 1 specific villager. I think Nintendo might have meant for them to provide more of a variety of options to people as the animal species (not specific villagers) all have the same chance of appearing on them. This is a huge improvement over previous games when random was basically the inevitable thing to happen if you didn't adopt from someone else... It allows the user some degree of choice, but I don't think they intended or wanted people to abuse the islands in search of Raymond or any 1 specific villager for that matter... They're meant to be used for resources, a fun trip to get away from your island, and maybe invite a villager too, but not to grind them for a business cat.
Why did you do this?
I was curious and a lot of others were as well, and I had seen some unproven theories going around. I wanted to let the data speak for itself and finally get a concrete theory found to try and dispel these myths and not give people false hopes. Being at home for the rest of the semester has given me a lot of free time to do whatever, so I decided to actually use the skills I learned while suffering through the econometrics course I had to take for my economics major.
Now the big question that a lot of you are wondering…
What does this mean for Raymond hunting?
Well, I'll tell you. The cat is even more elusive than we originally thought! It means that the chance to find Raymond on mystery islands is very low. It's lower than 1/391 because there are 20+ cats in this game. In fact, I have calculated the chance to find Raymond on a mystery island to be about 0.12% Basically 1 in a 1000. Good luck! Additionally, there is no time of day that increases your chances for Raymond.
The campsite trick will give you much better odds for Raymond. My friend (DrJaysAnatomy#4258 on Discord) wrote up a guide on it:
https://docs.google.com/document/d/1c8rsKWWtwsOo_JOxwO-lVRx2MUhc-bcdZg1mhXgtRPg/edit?usp=sharing
Another one of my friends (JacobHowie#4068) has made a tier list of the villagers from compiled data and expands on this theory with more stats like Poisson’s approximation applied to it. Super interesting, and you can check it out here if you want more statistics in your life:
https://docs.google.com/spreadsheets/d/1qd18A0tWlalvTDWSyjob3feG9vlLqhSkTxGI3p41Jws/edit?usp=sharing
Lastly, if anyone is curious about more things to test for with the mystery island villagers, just DM me on discord (ctar17#3628), and I'll give more thoughts on the idea! I’m also always looking for more data (make sure it’s complete though i.e. include all islands in a time period, be careful to not skip writing down any villagers you meet during the period of collection.)
Once again, thanks to all who sent data to me, there are almost 700 island entries so far! I plan to update this document as I come to more conclusions as well!
Also, here is the original post on TBT that also contains more FAQs to help you as well:
Happy hunting!
~ctar17
Appendix:
Probability values for each species calculated:
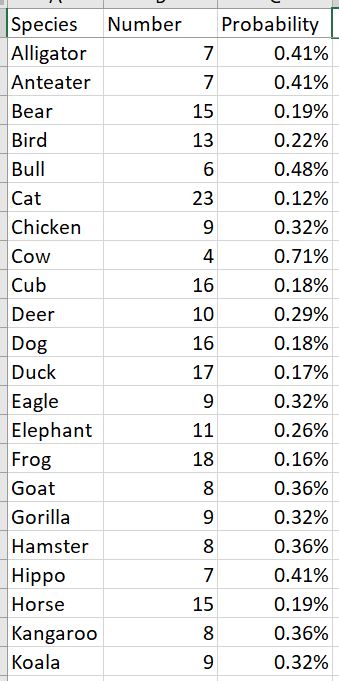
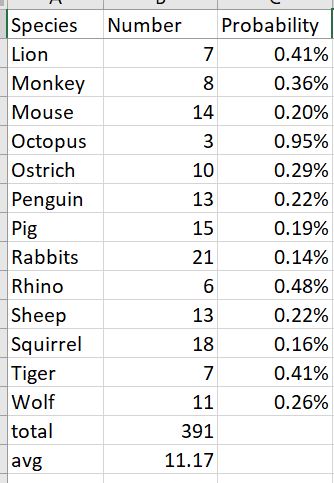
Equation used: (1/35)*(1/# of villagers in species) = probability for specific villager from species
All data was analyzed using Microsoft Excel, calculations were also done in Excel as well.