
Yet Another Serial Plotter
17-03-2019
Cricri_042
DevLabNet
Montbrison, FR42600
Overview
YAP is a combination of the standard “Arduino Serial Monitor” and the “Arduino Serial Plotter”.
You can either send and receive data via the monitor, the plotter part can receive data from an Arduino, or any serial source, by parsing specially formatted messages.
Currently plots supported are “Time Plots” :
Time plots, which are similar to a chart recorder, showing a number plotted against time. Time plots support auto-scrolling, which keeps the edge of the time axis set to the current time so that old values scroll off the left of the plot. All the data is retained though. You can zoom out, or pause the plot, and see the earlier data. You can also do simple measures on the plot.
The maximum number of plot has been fixed to 10 (Plot index 0 to 9).
In addition, Widgets capability, allows you to open simple “widget” like “Slider” or “Dial” to send data to the microcontroller via the Serial port.
The easiest way to send data to the plots is to use the provided YASP Arduino Library.
If you are not using an Arduino compatible device, or prefer to send raw messages, the Yasp Plotting Message Reference describes the message format expected by the YASP plot engine.
Goals
- Do “all-in-one” for both Serial Monitor and Plotter.
- Allow to Manipulate, Measure and save received data received.
How to get It
YASP is provided as “Open Source”, it has been developed using QT, in conjunction with “QCustomPlot”.
All the source code for the plotter and for the “YASP” arduino library can be downloaded on GitHub. For those who don’t like to compile it, an installer is also downloadable (Windows Version). Simple sketches example are also available under the “yasplib/example” subdirectory.
Special thanks to
- QT Developers team,
- QCustomPlot Developers team.
Let Start, Configure the Serial Connection
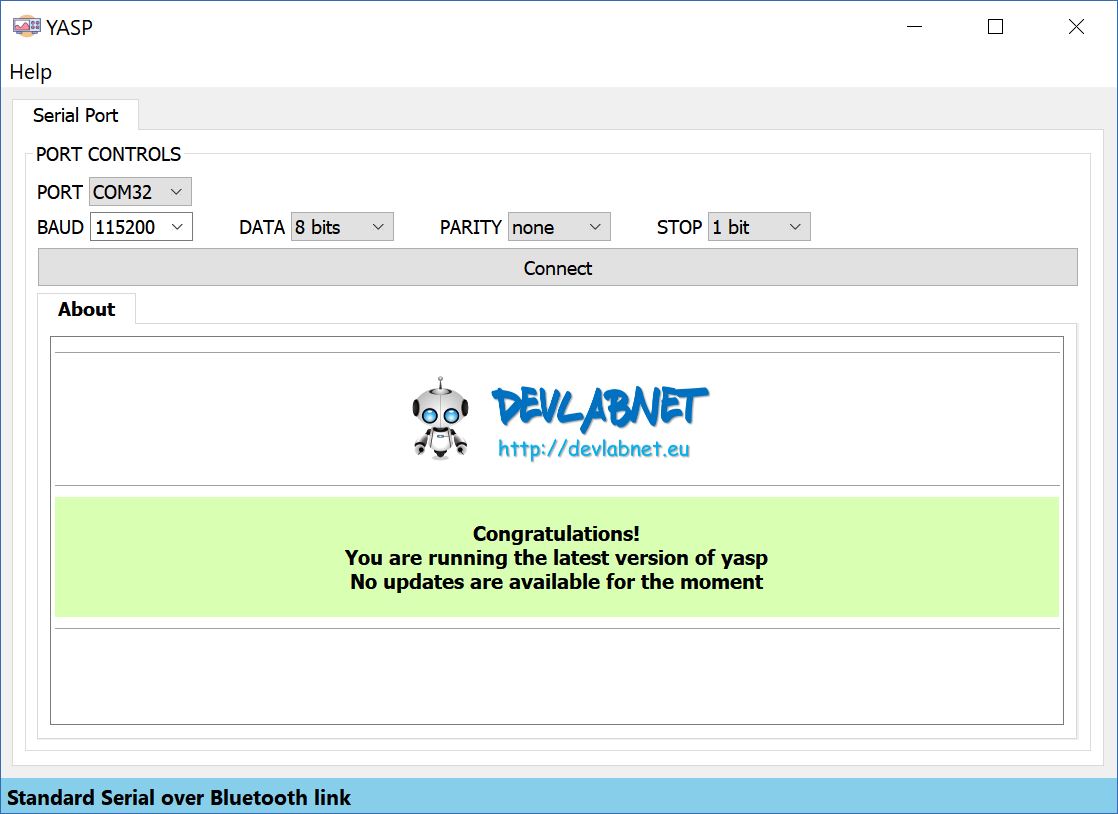
When launched, you will get the Connection Manager Windows to configure connections.
For a serial connection you can set:
- PORT: the COM port the Arduino is connected to
- BAUD: the baud-rate your Arduino is using. Make sure that the baud rate selected matches the value set when your Arduino program calls Serial.begin(9600). The most common value is 9,600 baud.
- DATA: the number of data bits used.
- PARITY: the parity scheme used.
- STOP: the number of stop bits used.
- Connect/Disconnect: opens and closes the the connection to your device.
Let Play, Connect It
When connected, we automatically jump to the “Terminal / Plot” page:
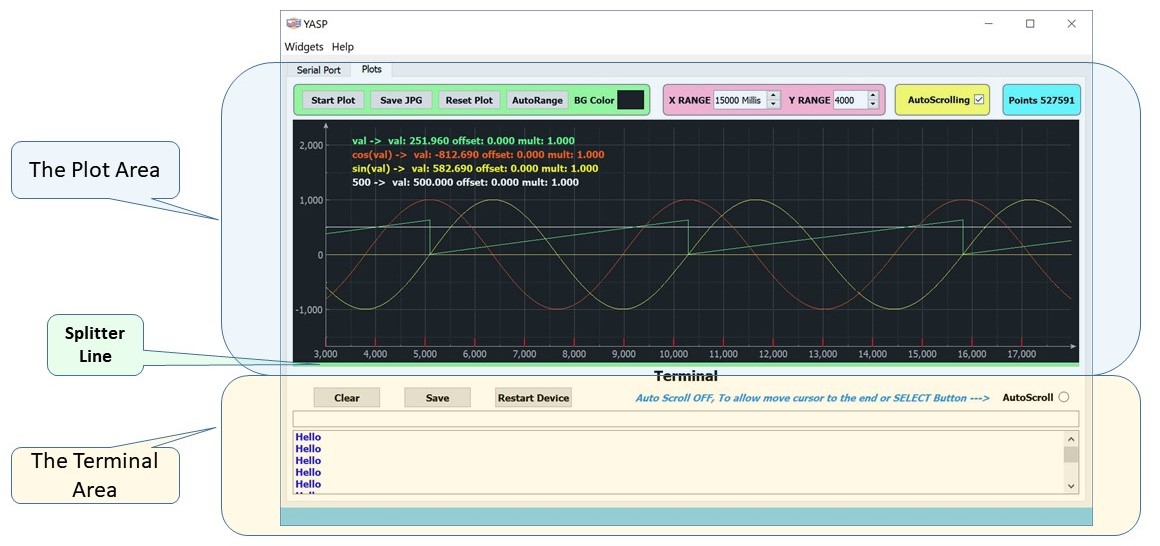
The Terminal
This is quite like the “Standard Arduino Terminal”.
Its job is to allow you to both send messages from your computer to a microcontroller board (over USB) and also to receive messages from the microcontroller.
Buttons allows you to:
- Clear its content.
- Save its content to a file.
- Reset (“reboot”) the microcontroller
The Plotter
The Plotter Interface allows plotting of multiple analog and digital channels, and allows enabling/disabling analog channel plotting, color selection, and whether to view the current analog values for each channel, the maximum, the minimum, …
It allows also to shift, scale and make several measurements on a selected plot.
The Plotter in detail
The Top Menu Bar
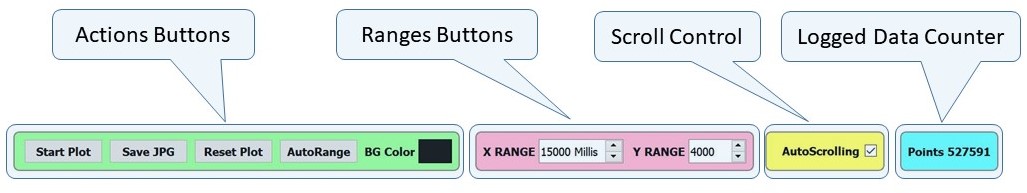
Actions Buttons:
- Start/Stop: This allows to ‘freeze” the plots (when stopped, data from microcontroller continue to be logged).
- Save JPG: To save the plot screen in a jpeg image.
- Reset Plot: Reset all the plots with their default values (reset “shift” to 0 and “scale” to 1.0).
- BG Color: To change the background color.
- AutoRange: To adjust Y scale to fit all plots.
Ranges Buttons:
- X Range: Set the “total” displayed time (in milliseconds).
- Y Range: Set the vertical displayed range.
Scroll Control:
- If checked, plots will “smoothly” scroll, even if no new data is coming
Finally, the las box (in blue) just display the number of data who are currently logged.
Remark: “wheel Mouse” will allow to adjust the X-Range, “wheel Mouse with right Button pressed” will allow to adjust Y-Range.
The Plot Area
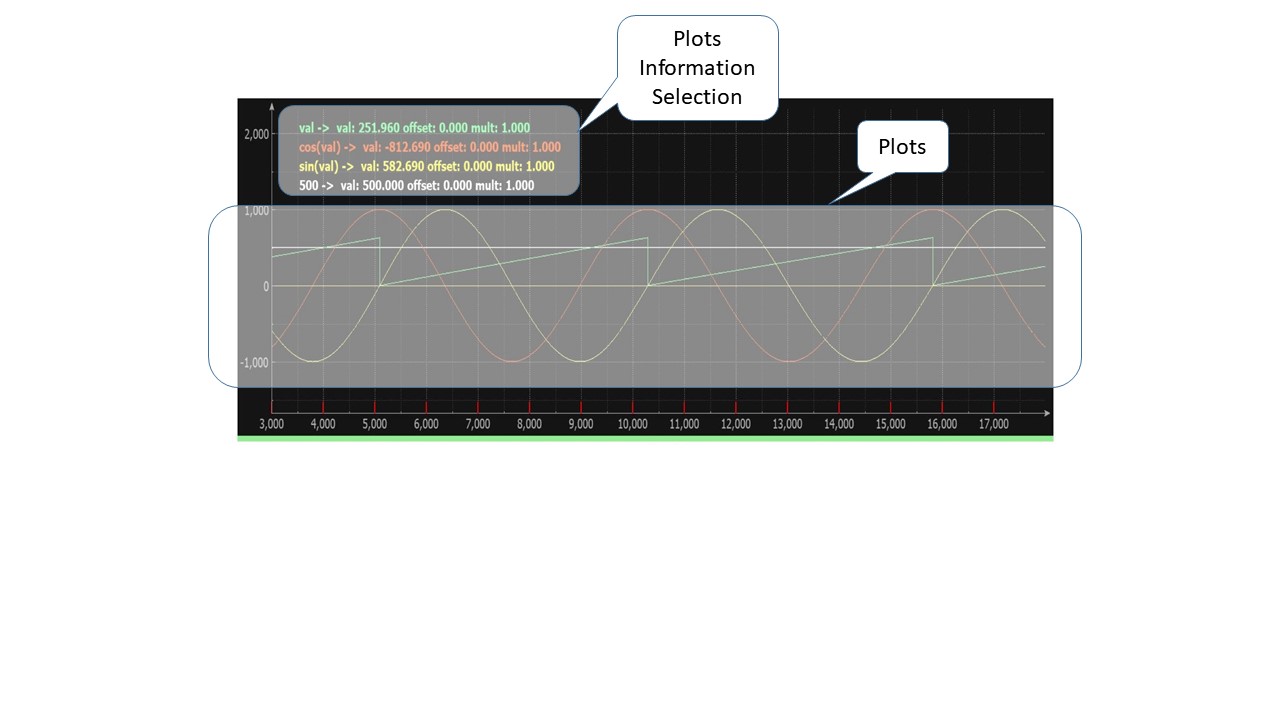
The “Plots Information Selection” part show current information about each plot (name, Y value, offset and scale factor).
A specific graph can be selected by clicking on a plot information line (see plot context menu in detail section).
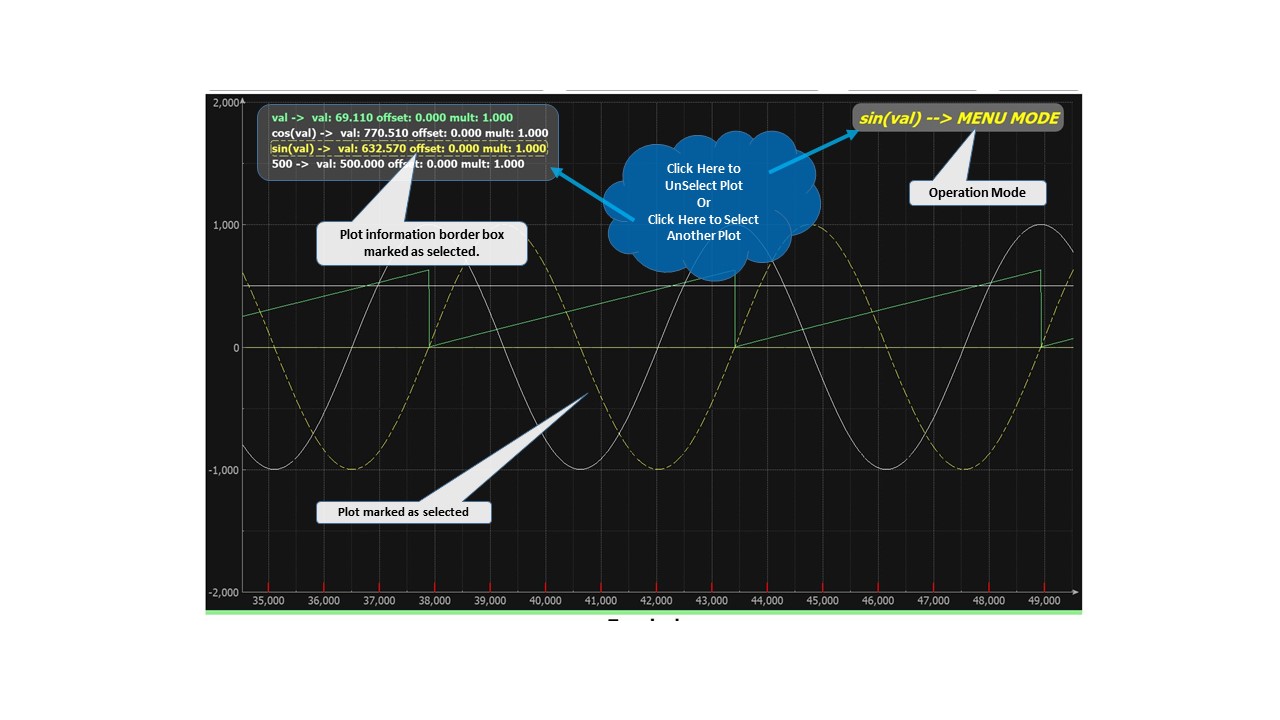
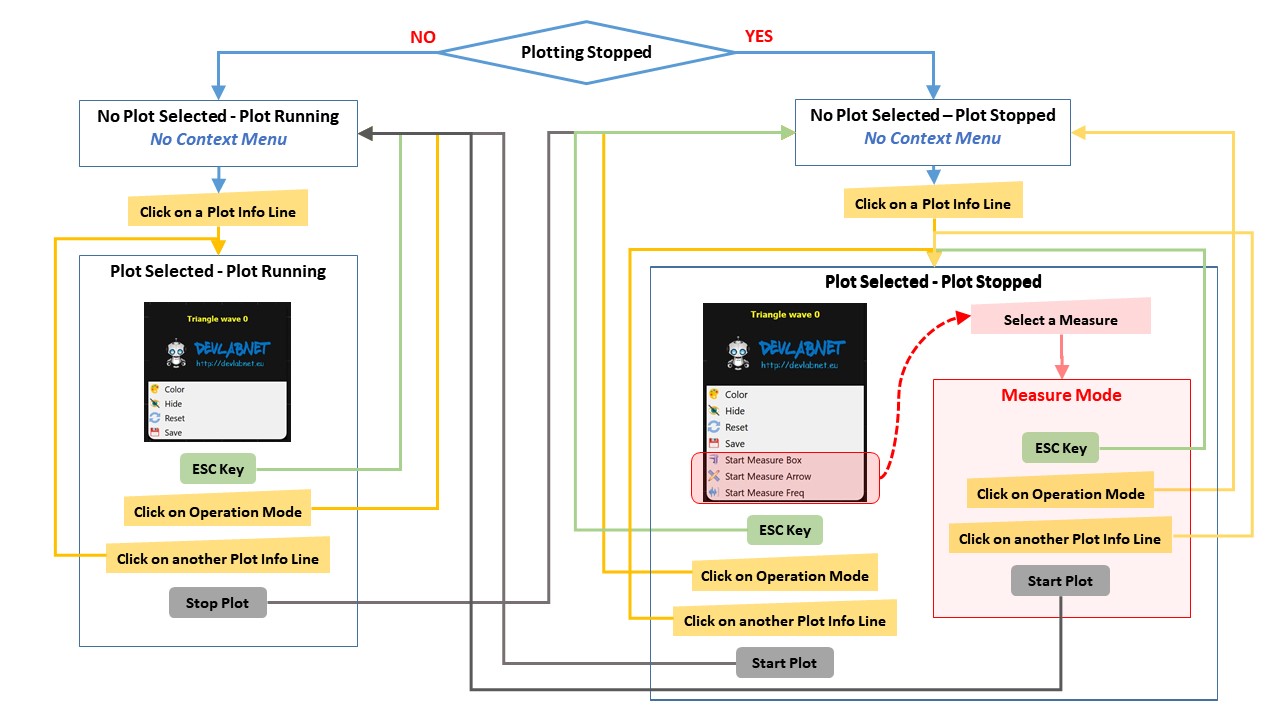
Context menu in details
To select a specific graph, just click on his “Information line”. Once one plot is selected, we will get the following view:
If a plot is selected, left click on the plot area will popup a context menu :
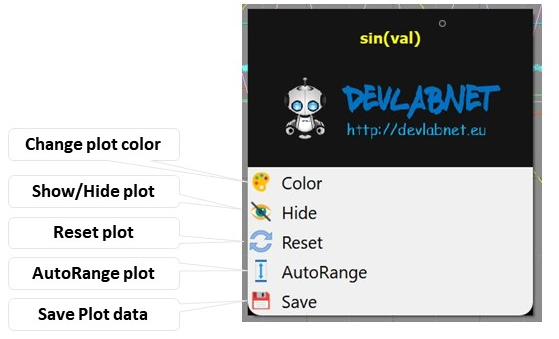
Here we can:
- Change the color of the plot.
- Show/Hide the selected plot.
- Reset plot values (Offset, Scale) to default.
- AutoRange plot (Scale Y Range to best fit the plot Values).
- Save the plot logged data in a “Comma-separated values” file.
Remark 1: When a plot is selected, the “wheel Mouse” will allow to “scale” the selected graph, and “Right-Shift Mouse” allows to move (offset) the selected graph.
Remark 2: When a plot is selected “ESC Key” will unselect it !.
Context menu when plotting is “Stopped”
If plotting mode is stopped and if a graph is selected, the context menu will show several other options:
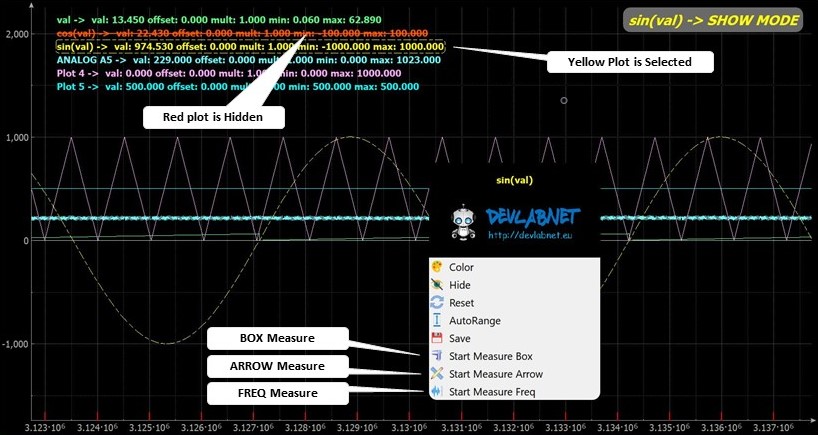
Measures will allow to make some measurements on the selected plot. See “Measures in detail Section”.
Remark: By default, the context menu “Measures” will be shown in the context menu only if the plotting is stopped.
Here you can perform:
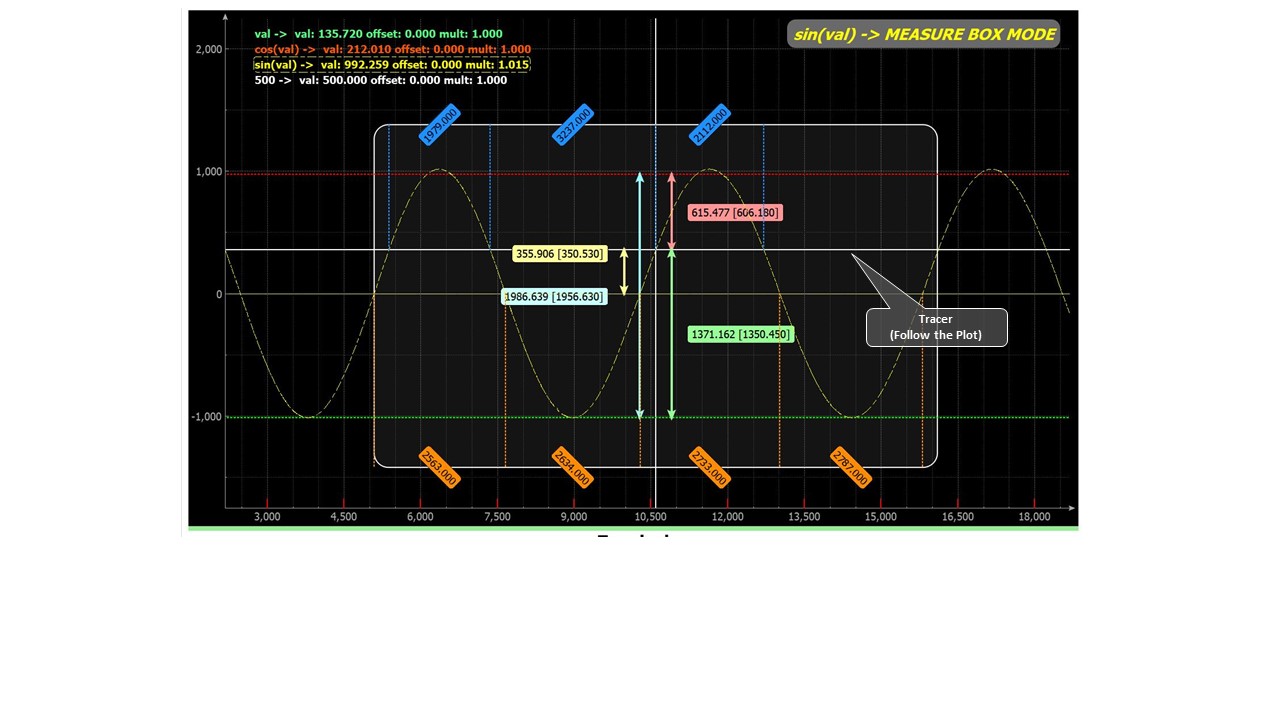
- BOX Measure : Will display a box with several X-Axis (time), and Y-Axis (Amplitude) Values.
- ARROW Measure : Allow to measure values between two points of the plot.
- FREQ Measure : Allow to measure “Frequency/Period” in a specified time interval.
Remark : When a measure is selected “ESC Key” will deselect the current measure Mode (and a second “EXC Key” will unselect the plot).
Recap of Contextual Menu
Measures in detail
BOX Measure
ARROW Measure
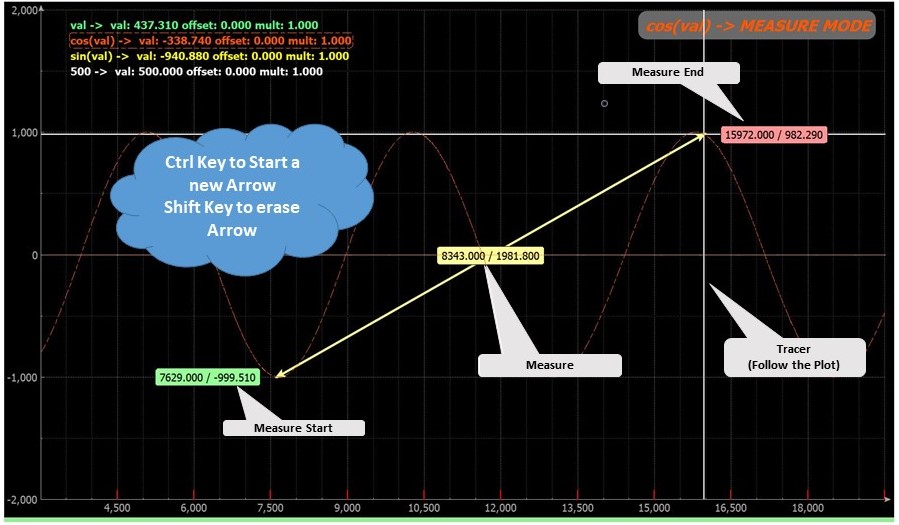
Ctrl and Shift Keys in ARROW Measure
When in “ARROW” Measure mode :
- Ctrl Key will start a new Arrow.
- Shift Key will erase the Arrow
FREQ Measure
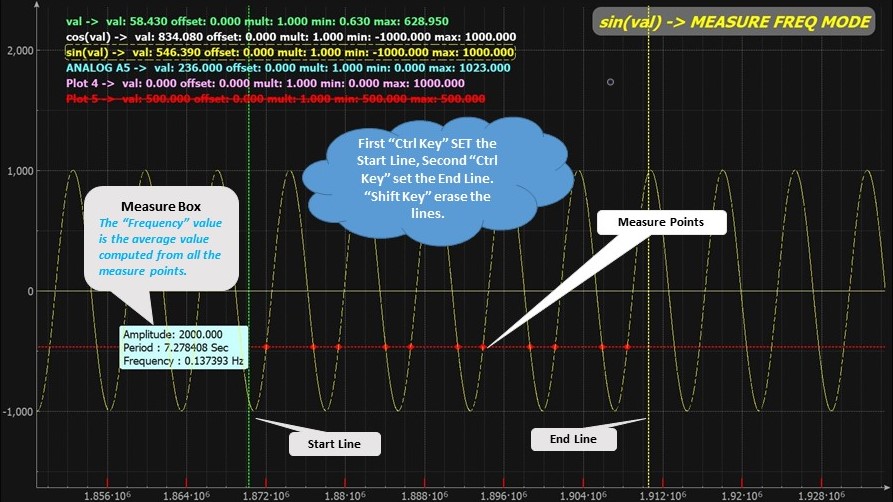
Ctrl and Shift Keys in FREQ Measure
When in “FREQ” Measure mode :
- First Ctrl Key will Fix the Left Vertical line position.
- Second Ctrl Key will Fix the Right Vertical line position.
- Shift Key will Fix erase the measure lines.
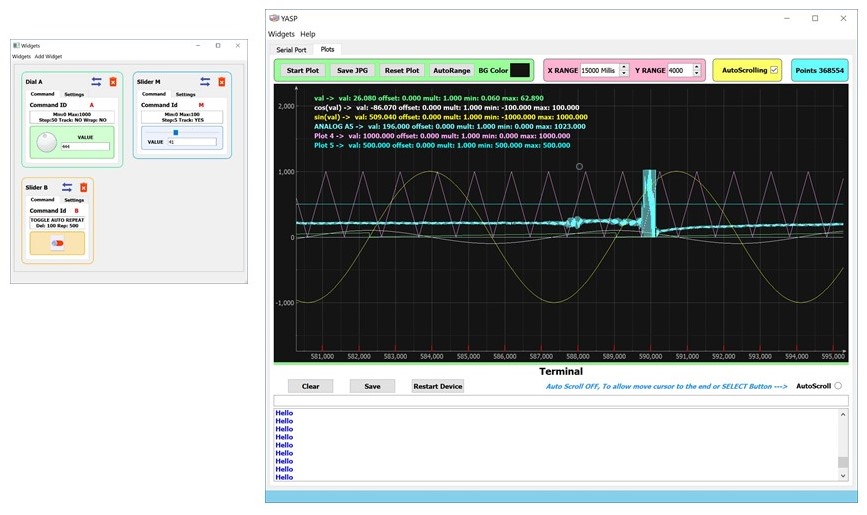
Widgets
Widgets allow to add simple BOXES like “Slider” or “Dial” to send data to the Arduino (microcontroller) via the Serial port.
The easiest way to send data to the Arduino is to use the provided YACL Arduino Library.
The widgets menu will be visible only if the plotter is connected to a device (Serial Port Opened). Once connected, juste click on “Widgets” in the Menu Bar, and click on “Show Hide widgets”
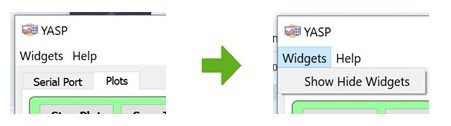
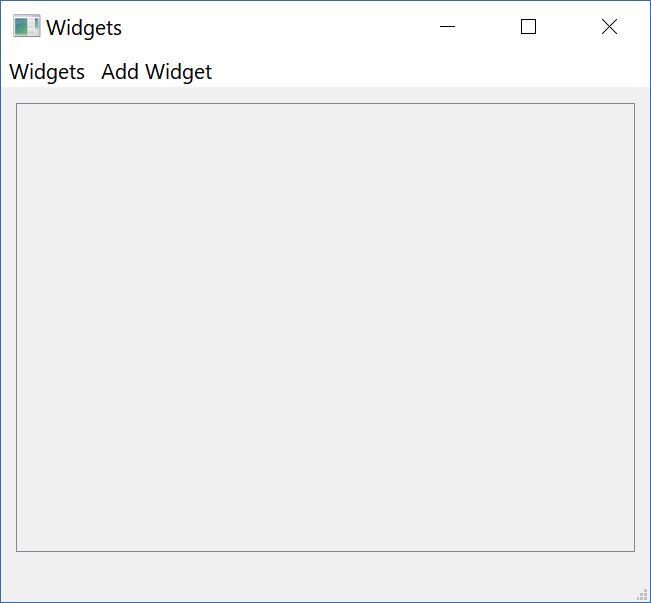
Which will open the “Widgets PoPup” :
Widgets Menu:
:
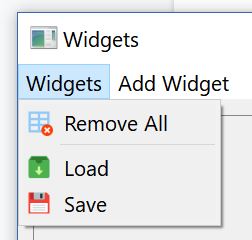
- Remove All: Delete all Widgets
- Load : Load widgets previously saved in XML file.
- Save: Save current widgets in an XML file.
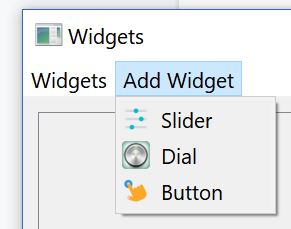
Then with “Add Widget” menu, you can Add a widget. Available widgets are :
- Slider Widget (The slider is the classic widget for controlling a bounded value)
- Dial Widget (rounded range control (like a speedometer or potentiometer)
- Button Widget (Push Button / Switch Button)
Just Select the kind of widget you like to Add :
The “SLIDER” Widget
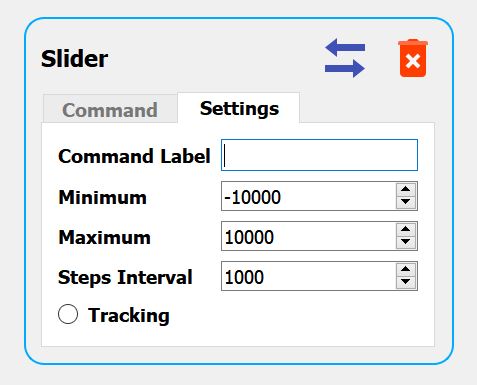
Once added, you need to set the “Command Keyword” associated to that widget. The command keyword will be the “Prefix” added when sending the value through the Serial Port. For example, id the given keyword is “DX”, the string “DX xxxx” will be sent to the Arduino through the Serial Port (Where xxx.xxx is the Slider value).
You can also specify the Minimum, Maximum and Ticks Interval values.
Once the “Command Keyword” is set, the “Command Tab” will be enabled, and then you will be able to play with it !!
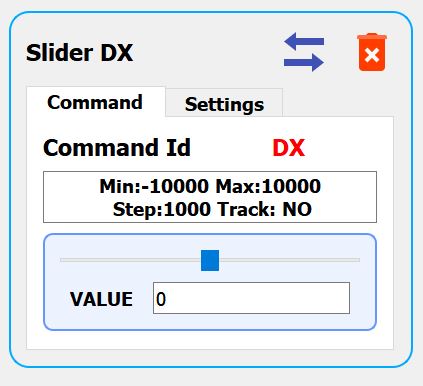
Then, moving the Slider, will send the “DX xxxx” string through the Serial Port.
(See YACL Library to learn how to easily parse and decode this command on the Arduino side)
The “DIAL” Widget
Similar to the SLIDER widget, the DIAL Widget allow to send data with a potentiometer like control.
As an example, if adding a “Slider widget” and a “Dial widget” will give the following BOX:
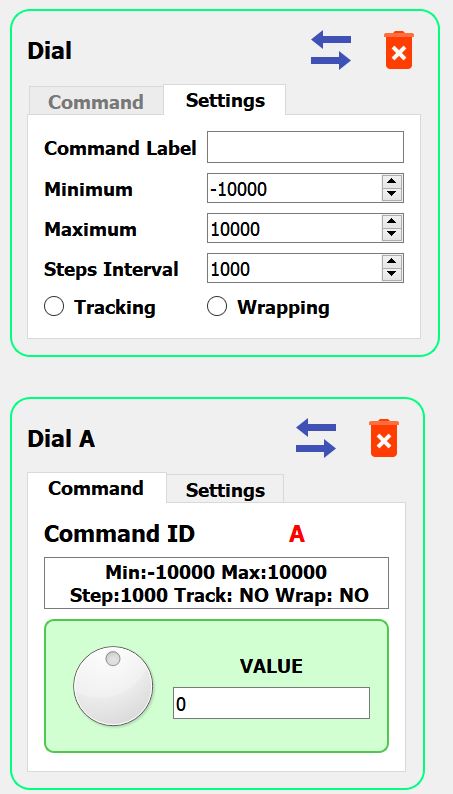
Here, the “Dial” will send “A xxxx” Values.
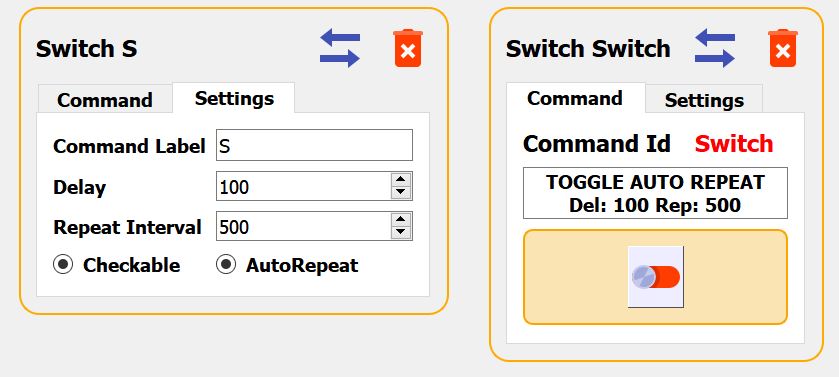
The “BUTTON” Widget
If “Checkable” is not selected, you’ll get a “PUSH” Button :
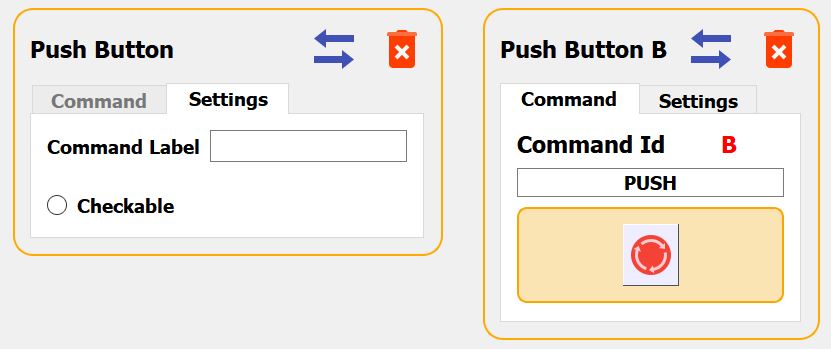
If “Checkable” is selected, you’ll get a “SWITCH” Button (with optional “Auto-Repeat” capability :
YASP Arduino Library
Getting Started
To start using YASP, just include the library header "<yaspLib.h>" and create a "Plotter" Object in your sketch file :
#include <yasplib.h>
yaspLib myPlot(Serial);
unsigned long plotMillis; int val = 500;
Then optionally, add any (up to 10) "plots" description in your setup() function.
void setup() {
Serial.begin(115200);
// ADD a Plot description: Indice = 0, Name = "Triangle wave 0" and Color = yellow.
myPlot.Setup(0, "Triangle wave 0", "#ffff00");
plotMillis = millis();
}
Thensend data for this plot in the loop() function
void loop() {
if (millis() >= plotMillis) {
// Send Data to plot 0
myPlot.Data(0, val);
val = -val;
plotMillis = millis() + 50;
}
}
For a more complex exemple, look at samples in the examples directory. All samples are heavily documented and should be self explanatory.
yaspLib Public Members Functions
| yaspLib (Stream &dev) | Constructor |
void | Setup (int ind, char *name, char *color) | Setup a plot by assigning an indice, name and color |
void | Color (int ind, char *color) | Change color of the related plot |
void | Data (int ind, double val) | Send Data to the plot (Here the timeStamp will be the time (microseconds) where the instruction is executed |
void | DataMicros (int ind, unsigned long m, double val) | Send Data to the plot with a specified timestamp (in microseconds) |
void | DataMillis (int ind, unsigned long m, double val) | Send Data to the plot with a specified timestamp (in milliseconds) |
YASP Plotting Message Reference
YASP gets information for plotting data from specially formatted commands in serial streams. Here is the code details for each YASP Methods used when sending messages:
enum MsgType {
START_MSG = 0x10,
PLOT_MSG = 0x11,
END_MSG = 0x12,
SPACE_MSG = 0x13
};
void yaspLib::Setup(int ind, char* name, char* color) {
stream.write(PLOT_MSG);
stream.print(ind);
stream.write(SPACE_MSG);
stream.print(name);
stream.write(SPACE_MSG);
stream.print(color);
stream.write(END_MSG);
}
void yaspLib::Color(int ind, char* color) {
stream.write(PLOT_MSG);
stream.print(ind);
stream.write(SPACE_MSG);
stream.print(color);
stream.write(END_MSG);
}
void yaspLib::Data(int ind, double val) {
stream.write(START_MSG);
stream.print(ind);
stream.write(SPACE_MSG);
stream.print(micros());
stream.write(SPACE_MSG);
stream.print(val);
stream.write(END_MSG);
}
void yaspLib::DataMicros(int ind, unsigned long m, double val) {
stream.write(START_MSG);
stream.print(ind);
stream.write(SPACE_MSG);
stream.print(m);
stream.write(SPACE_MSG);
stream.print(val);
stream.write(END_MSG);
}
void yaspLib::DataMillis(int ind, unsigned long m, double val) {
stream.write(START_MSG);
stream.print(ind);
stream.write(SPACE_MSG);
stream.print(m * 1000);
stream.write(SPACE_MSG);
stream.print(val);
stream.write(END_MSG);
}
YACL Arduino Library
To start using YACL, just include the library header “<yaclLib.h>” and initialize the Command Line Engine "YACL_USE_YACLLIB" in your sketch file :
#include <yaclLib.h>
YACL_USE_YACLLIB;
Then Define the functions to call for each "command TOKEN"
//******************************
// Add your commands function code here
//------------------------------
void myCommandTest() {
// Here the command code to run when receiving the "Test" token
// .....
}
Then Add your commands "token" and related "function names"
//******************************
// Add your commands "token" and "function names" here
//------------------------------
YACL_CMDS_LIST myCommands[] = {
{"Test", myCommandTest}
};
//******************************
Then init the command line in your setup() function and Check (as often as possible) for any commands from the serial in the loop() function
void setup() {
Serial.begin(115200);
// INIT THE COMMANDS
YACL_INIT_CMDS(Serial, myCommands);
}
void loop() {
// CHECK FOR COMMANDS AS OFTEN AS POSSIBLE
YACL_CHECK_CMDS;
}
For a more complex exemple, look at the "Calculator" in the examples. All samples are heavily documented and should be self explanatory.
YACL Predefined MACROS
To ease coding, some Predefined Macros are available:
- Get Numeric Value (if no numeric is available or if not a well formatted, YACL_OK will return false):
- YACL_GETINT: Return the next INT in the command Line
- YACL_GETLONG: Return the next LONG in the command Line
- YACL_GETFLOAT: Return the next FLOAT in the command Line
- YACL_OK: Return false if expected number is not found or is not well formatted
- Get String Value:
- YACL_GETSTR: Return the next STRING in the command Line
- Print/Write:
- YACL_PRINT(x): Print x value, this is the same as Serial.print(x)
- YACL_PRINTLN(x): same as Serial.println(x)
- YACL_PRINT2(x, y): Print x value in specific format, this is the same as Serial.print(x, FORMAT)
- YACL_PRINTLN2(x, y): same as Serial.println(x, FORMAT)
- YACL_WRITE(x): Writes binary data to the serial port
- Last Token:
- YACL_TOKEN: Return the last command line token found
Table of Contents
Let Start, Configure the Serial Connection 2
Context menu when plotting is “Stopped” 6
Ctrl and Shift Keys in ARROW Measure 8
Ctrl and Shift Keys in FREQ Measure 8
yaspLib Public Members Functions 12
YASP Plotting Message Reference 13