Product Technical Background Document
Regional Drought & Crop Yield Information System (RDCYIS)
Production Partners

April 2019
Executive Summary
Agriculture is a key element of the economies in Lower Mekong region. However, many of the agricultural systems in the region are rain-fed and thus are highly vulnerable to climate change and variability. Seasonal forecast information on drought and crop productivity benefits the agricultural, economic, and possibly other sectors by providing quantitative, targeted, risk-based information to planners, policy-makers, and other stakeholders.
The Regional Drought and Crop Yield Information System (RDCYIS) is an integrated system that is designed for drought monitoring, analysis and forecasting as well as crop yield estimation. The RDCYIS meets the growing demand of an effective monitoring and forecasting system for drought and crop yield estimations by the Lower Mekong countries. The RDCYIS is now publicly available online through https://rdcyis-servir.adpc.net. It has been developed by the Asian Disaster Preparedness Center (ADPC), under the SERVIR-Mekong program, and with technical support from the NASA Jet Propulsion Laboratory as well as technical partners in the region. The RHEAS modeling framework which is the heart of the RDCYIS is software framework for hydrologic modeling and data assimilation that automates the deployment of water resources nowcasting and forecasting applications. The object-oriented design of the framework allows for modularity and extensibility, showcased here with the coupling of the core hydrologic model with a crop growth model.The resulting hydrologic variables, drought assessments, and crop productivity products are then directly available for use by environmental and agricultural decision makers.
The primary purpose of this technical background document is to present simply the comprehensive technical know-how comprised in the development of RDCYIS to the users who utilize the information system for effective decision making to prepare and respond to droughts and agricultural planning in their local context. This technical background document is also provided key functions and outputs, limitations, gender considerations and possible next developments of the information system.
Acknowledgements
On behalf of the initiative of development of Regional Drought and Crop Yield Information System (RDCYIS) for the benefit of the people of Lower Mekong Region to better respond the drought phenomena, Asian Disaster Preparedness Center (ADPC)/SERVIR-Mekong would like to graciously thank the donor, United States Agency for International Development (USAID), for their generous financial support for the SERVIR-Mekong initiative under SERVIR Global initiative. ADPC /SERVIR-Mekong would also like to thank the main technical partner National Aeronautics and Space Administration (NASA) and NASA-Jet Propulsion Laboratory (JPL)-USA and supporting organizations for co-development the RDCYIS, namely Stockholm Environment Institute (SEI)-Thailand, Spatial Informatics Group (SIG), Mekong River Commission (MRC) and Vietnam Academy of Water Resources (VAWR)-Vietnam. Their contributions were invaluable to the success of the development of information system.
Special thank also goes to the stakeholders who participated the inception and other subsequent workshops in contributing valuable guidance for developing user friendly web-based information system under the SERVIR-Mekong initiative.
ADPC/SERVIR-Mekong would also like to thank all reviewers for contributing valuable and constructive suggestions for improving this Technical Background Document of RDCYIS.
Citation:
Regional Drought and Crop Yield Information System (RDCYIS), 2018, ADPC/SERVIR Mekong
Table of Contents
Regional Drought & Crop Yield Information System (RDCYIS): Origin of Need 7
RDCYIS: Context of Decision making 8
RDCYIS: Product Complement to Existing Resources 8
Collaboration and Partnerships 9
Collaboration between SERVIR-Mekong and NASA – NASA-JPL 9
Co-Production Partnership 9
Diagrammatic Representation of the RDCYIS 11
Component Description 11
Technical Inputs 18
Data Inputs 18
Calibration/Validation 19
Development of Web-based User Interface 22
List of Figures
Fig 1: RDCYIS General Framework
Fig 2: Modules of RHEAS Modeling Framework
Fig 3: Spatial Map Outputs
Fig 4: Time series graph Outputs
Fig 5: Map of Crop Yield Estimation
Fig 6: Web-based User Interface
Fig 7: Nowcast and Forecast Configuration of RHEAS
Fig 8: Comparison of RHEAS and GLADS Soil Moisture Products
Fig 9: Approach of Developing Web-based tool for RDCYIS
List of Tables
Table 1: Data Inputs. Available Datasets, Their Characteristics and the Database Schema/Table
Table 2: Data Inputs. Available Datasets and the Database Schema/Table
Table 3: Selected Input Data for Ingesting to the RHEAS Model
Table 4: Product Validation, Comparison of Soil Moisture products of RHEAS and SMAP
Acronyms
ADPC Asian Disaster Preparedness Center
CHIRPS Climate Hazards Group InfraRed Precipitation with Station data
DSSAT Decision Support System for Agro-Technology Transfer
ESP Ensemble Streamflow Prediction
GIT Geospatial Information Technology
GLDAS Global Land Data Assimilation System
JPL Jet Propulsion Laboratory
LMB Lower Mekong Basin
LMR Lower Mekong Region
MRC Mekong River Commision
NASA National Aeronautics and Space Administration
NCEP National Center for Environmental Predictions
NMME North American Multi-Model Ensemble
PTF Pedo-transfer Functions
RDCYIS Regional Drought and Crop Yield Information System
RHEAS Regional Hydrologic Extreme Assessment System
SEI Stockholm Environment Institute
SIG Spatial Informatics Group
SMAP Soil Moisture Active Passive
SMOS Soil Moisture Ocean Salinity
USAID United States Agency for International Development
VAWR Vietnam Academy of Water Resources
VIC Variable Infiltration Capacity model
Background and Context
SERVIR-Mekong
The SERVIR-Global network of regional geospatial support hubs is an initiative of the United States National Aeronautics and Space Administration (NASA) and the United States Agency for International Development (USAID). SERVIR-Mekong, the newest hub in the network is a geospatial data for development program designed to respond to the needs of the Lower Mekong countries. It builds the capacity of governments and other key stakeholders in the Lower Mekong countries to employ publicly available satellite imagery and geospatial technologies for decision making related to climate change, environmental management, and disaster risk management. SERVIR-Mekong is being implemented by the Asian Disaster Preparedness Center (ADPC) and its technical partners, Spatial Informatics Group (SIG), Stockholm Environment Institute (SEI) and Deltares.
Regional Drought & Crop Yield Information System (RDCYIS): Origin of Need
Drought is a natural hazard characterized by abnormal precipitation lower than expected leading to insufficiency in meeting the demands of human activities and the environment. It is a regional phenomenon and its characteristics varies from one climate to another. The Lower Mekong Basin (LMB) has a typical monsoon climate, with high temperatures and an uneven distribution of precipitation throughout the year. This climate, combined with the geographic position of the LMB, has led to an increase in the frequency of extreme weather events over last decade. Unlike floods, which provide many benefits to the Mekong Basin’s agriculture and ecosystems, drought only brings socio-economic hardship to riparian countries, especially the farming communities. Therefore, considering the increase in the frequency of drought occurrence in the region, it is necessary that a drought monitoring system be put in place that would enable lower Mekong countries to be better prepared for drought adaptation and mitigation strategies by monitoring, analysis and implementing measures to minimize crop losses to the vulnerable farming communities. The impacts from 2015 El Nino that resulted in prolonged droughts over the region, made the country Governments to think and come up with a near real time drought monitoring system to respond to situations as and when it arises.
The need assessment carried out in late 2014 and early 2015 to explain SERVIR-Mekong’s strategic focus identified drought monitoring, and forecasting as well as forecasting crop yields as one of the priority areas by the countries. Based on this assessment, the RDCYIS is currently being developed as an initiative under SERVIR-Mekong to help lower Mekong countries be able to monitor and assess drought conditions with respect to agricultural droughts and take effective decisions as the need arises. Based on the need assessment, priority needs and suggestions from stakeholders were identified and recommendations were made towards building their institutional capacity and improving the application of geospatial data and technologies for decision making in all Lower Mekong Countries engaged in drought monitoring and forecasting. The recommendations further suggest SERVIR-Mekong to work with stakeholders in countries to design, build and maintain decision support tools related to drought monitoring and forecasting as a priority area. Therefore, development of RDCYIS is demand driven as it was considered to be one of the most needed geospatial application for agricultural planning, water management and disaster risk management. It is further observed from the assessment that priority thematic areas where stakeholders reported that geospatial data and technologies are playing a key role also includes developing early warning systems for droughts and floods for disaster risk management, water resource planning, agricultural monitoring and food security; and climate change adaptation and mitigation. In terms of capacity building priorities, the need assessment also identified that SERVIR-Mekong works closely with stakeholders in developing custom tools and applications in areas related to mapping and monitoring land use/ land cover; flood and drought monitoring and forecasting; ecosystem services; crop yield forecasting; and facilitating basin-wide planning.
Therefore, based on the demand from the national governments, Mekong River Commission and other USAID activities to assist governments in seasonal drought forecasting for short and medium term mitigation measures during and in advance of droughts including crop planning and management, the decision to build the RDCYIS have been taken by SERVIR-Mekong to provide a near real time monitoring system.
RDCYIS: Context of Decision making
In the context of decision-making, the RDCYIS will address the much needed drought preparedness, monitoring and forecasting while assessing economic, social and environmental impacts in the Lower Mekong countries. The system will be able to provide insurers with spatially explicit, documented drought condition records while also allowing specific targeted decisions to be taken in the context of drought warnings, crop subsidies and insurance programmes.
RDCYIS: Product Complement to Existing Resources
The RDCYIS deploys the Regional Hydrologic Extreme Assessment System (RHEAS) that is an integration of hydrological and crop simulation models developed by NASA-Jet Propulsion Laboratory. The core of the RHEAS framework is the Variable Infiltration Capacity (VIC) model and the Decision Support System for Agro-Technology Transfer (DSSAT) model that automates the deployment of nowcasting and forecasting hydrologic simulations and ingests satellite observations through data assimilation. It also allows coupling of other environmental models and facilitates the delivery of data products to users via a GIS enabled database. The system’s ability to carry our nowcast and forecast within the framework at the same time gives an upper edge to the present existing resources or systems available for drought monitoring.
Collaboration and Partnerships
Collaboration between SERVIR-Mekong and NASA Jet Propulsion Laboratory – NASA-JPL
The Jet Propulsion Laboratory is a NASA national research facility that carries out robotic space and Earth science missions. JPL is a federally funded research and development center managed for NASA by Caltech. From the long history of leaders drawn from the university's faculty to joint programs and appointments, JPL's intellectual environment and identity are profoundly shaped by its role as part of Caltech. JPL continues its world-leading innovation, implementing programs in planetary exploration, Earth science, space-based astronomy and technology development, while applying its capabilities to technical and scientific problems of national significance. JPL technology developed to enable new missions is also applied on Earth to benefit our everyday lives. As part of the SERVIR program, JPL is currently assisting SERVIR-Mekong in implementing the RHEAS system in the region and also building the institutional capacity of Asian Disaster Preparedness Center (ADPC) within the SERVIR framework in aligning with USAID goals. Therefore, through NASA’s Applied Science Program also called as AST, the overarching goal of JPL is to provide to the SERVIR-Mekong hub hydrologic variables and drought indicators linked directly to the estimates of rice yield to be used by decision makers. This in turn would significantly improve the understanding of regional and national environmental conditions related to hydrology and crop yield and provide complementary information to support and improve decision-making process.
Co-Production Partnership
The RDCYIS have been built together with a consortium of SERVIR-Mekong partner agencies with the goal to jointly develop the system as well as build each others needed institutional capacities through knowledge sharing and exchange. These partner agencies forms part of co-production partners who assist not only in the co-production process of the tool but also identifies areas where information relevant to the tool development process can be shared. The partnership also assumes importance as it becomes the point of engagement between SERVIR-Mekong and the end-users to engage in the co-production process. The RDCYIS is jointly being developed with Mekong River Commission (MRC) Lao PDR, Vietnam Academy of Water Resources (VAWR) and Stockholm Environment Institute (SEI) Thailand. It is likely that more institutes will be joining the co-production process in the near future.
Objectives
The overarching goal of the RDCYIS is to explores and demonstrate drought risk reduction strategies by incorporating drought monitoring and forecasting information for effective decision making for the lower Mekong countries.
- Develop an integrated system for drought monitoring and forecasting information as well as crop yield information that would allow decision makers in planning and preparedness during drought situations;
- Provide decision makers better prepare and respond towards droughts as well as helping the planning agencies and agricultural extension workers to disseminate drought related information to the farming communities creating awareness. As well as helping farming communities in considering various economic incentives, affordable coping strategies, and agricultural interventions coupled with social support services for the lower Mekong countries; and
- Provide ecological and financial forecasting information that can inform seasonal cropping decisions while subsequent functionality may include additional information relevant to decisions at sub-seasonal or multi-year temporal scales.
The RDCYIS deploys the RHEAS system for monitoring, analysis and forecasting of drought. The system will develop products as nowcasts for monitoring current conditions and forecast for planning and mitigation in the long run. The system is expected to significantly improve the understanding of regional and national environmental conditions related to hydrology, crop yield, and provide complementary information to support and improve decision-making processes.
The main expected outputs from the RHEAS includes:
- Drought Indices
- Soil Variables
- Energy Balance Variables
- Water Balance Variables
- Crop Yield Estimations
Methods
Diagrammatic Representation of the RDCYIS
This general framework of RDCYIS is shown the entire process of developing the system and user engagements for decision making.
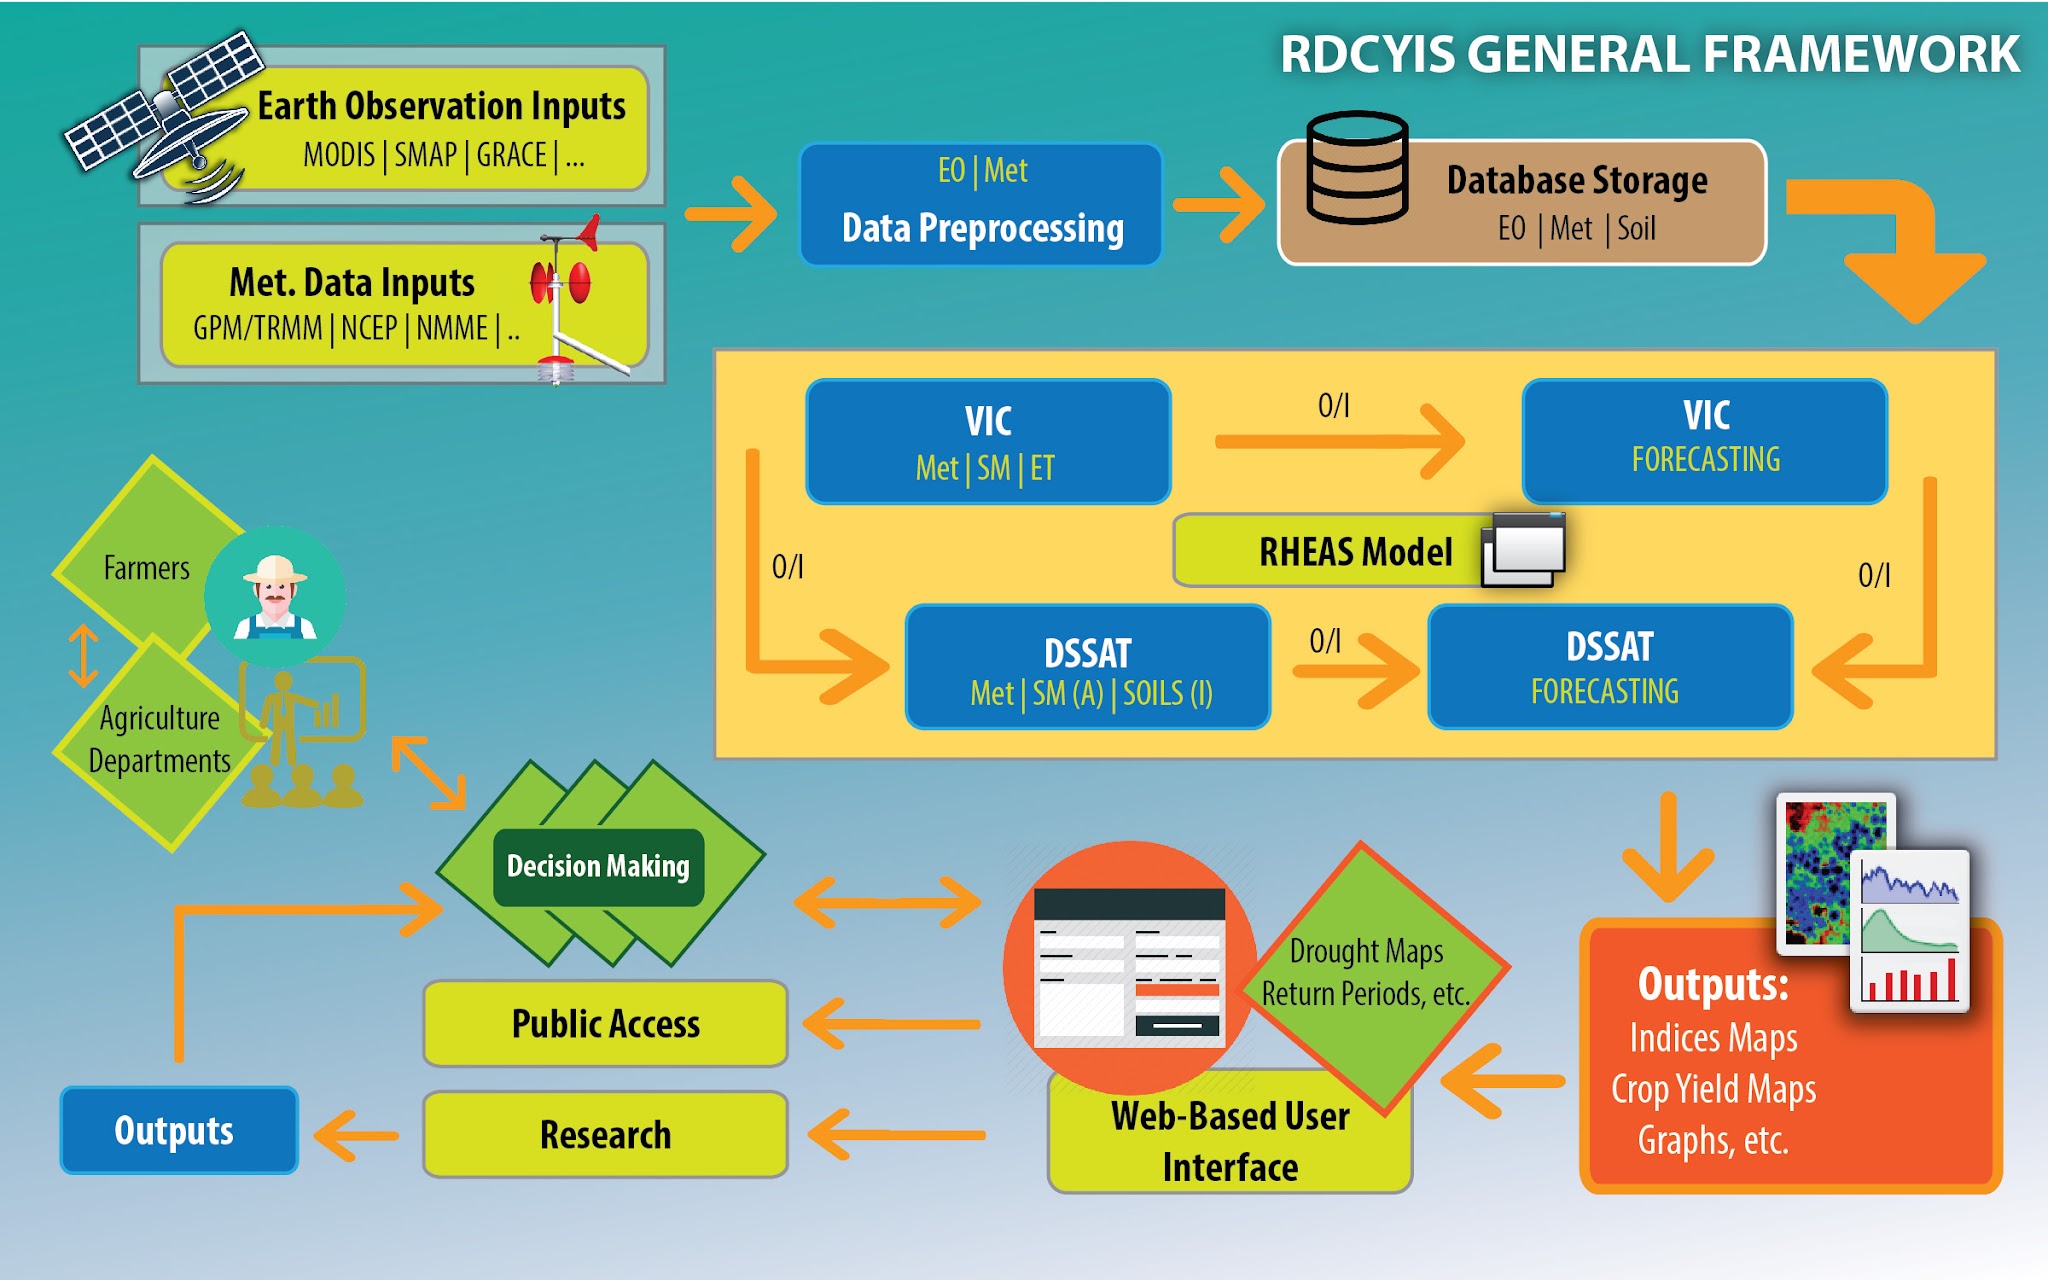
Fig 1: RDCYIS General Framework
Component Description
- Data Inputs: describes the possible data inputs such as satellite derived meteorological and hydrological data, model derived meteorological data, in-situ data, etc. Details are given in below table.
Variable | Dataset | Tim. Cov. | Temp. Res | Spat. Res | Spatial Coverage |
Precipitation | CHIRPS | 1981- | Daily | 5km | Global |
Precipitation | TRMM | 1998- | Daily | 0.25 o | Global |
Precipitation | CMORPH | 1998- | Daily | 0.25 o | Global |
Precipitation | GPM | 2014- | Daily | 0.10 o | Global |
Temp/Wind | NCEP | 1981- | Daily | 1.875 o | Global |
Soil moisture | AMSR-E | 2002-2011 | Daily | 0.25 o | Global |
Soil moisture | SMOS | 2009- | Daily | ~40km | Global |
Soil moisture | SMAP | 2015- | Daily | 3/9km | Global |
Evapotranspiration | MOD16 | 2000- | 8 days | 1km | Global |
Water storage | GRACE | 2002- | Monthly | 1.0 o | Global |
Snow cover | MOD10 | 2001- | Daily | 1km | Global |
Snow cover | MODSCAG | 2001- | Daily | 1km | Global |
Leaf Area Index | MCD15 | 2002- | 8 days | 1km | Global |
Meteorology | IRI | 2000- | Monthly | 2.5 o | Global |
Meteorology | NMME | 2000- | Daily | 0.5 o | Global |
Table 1: Data Inputs. Available Datasets, Their Characteristics
- Data Preprocessing: describes all the preprocessings such as geometric, radiometric corrections, calibrating, formatting, etc. before feed in to the system.
- Database Storage: describes the systematic storage of preprocessed data. It is a PostGIS database (a spatially-enabled PostgreSQL database) that stores the necessary data to run RHEAS including model parameters, meteorological data (both forecasts and nowcasts), and remote sensing as well as in-situ observations. Details of stored data are given in below table.
Variable | Dataset | Spatial Coverage | Table | Mode |
Precipitation | CHIRPS | Lower Mekong Region (LMR) | precip.chirps | IN |
Precipitation | TRMM | LMR | precip.trmm | IN |
Precipitation | CMORPH | LMR | precip.cmorph | IN |
Precipitation | GPM | LMR | precip.gpm | IN |
Temp/Wind | NCEP | LMR | *.ncep | IN |
Soil moisture | AMSR-E | LMR | soilm.amsre | AS |
Soil moisture | SMOS | LMR | soilm.smos | AS |
Soil moisture | SMAP | LMR | soilm.smap | AS |
Evapotranspiration | MOD16 | LMR | evap.modis | AS |
Water storage | GRACE | LMR | tws.grace | AS |
Snow cover | MOD10 | LMR | snow.mod10 | AS |
Snow cover | MODSCAG | LMR | snow.modscag | AS |
Leaf Area Index | MCD15 | LMR | lai.modis | AS |
Meteorology | IRI | LMR | *.iri | FC |
Meteorology | NMME | LMR | *.nmme | FC |
(Mode: IN:- for Input, AS:- for Assimilation, FC:- for Forecasting)
Table 2: Data Inputs. Available Datasets and the Database Schema/Table
- RHEAS Model: The heart of this system is RHEAS model. The Regional Hydrologic Extremes Assessment System (RHEAS) is a prototype software framework for hydrologic modeling and data assimilation that automates the deployment of water resources nowcasting and forecasting applications. The object-oriented design of the software allows for modularity and extensibility, showcased here with the coupling of the core hydrologic model with a crop growth model. RHEAS can exploit multi-threading to scale with increasing number of processors, while the database allows delivery of data products and associated uncertainty through a variety of GIS platforms.
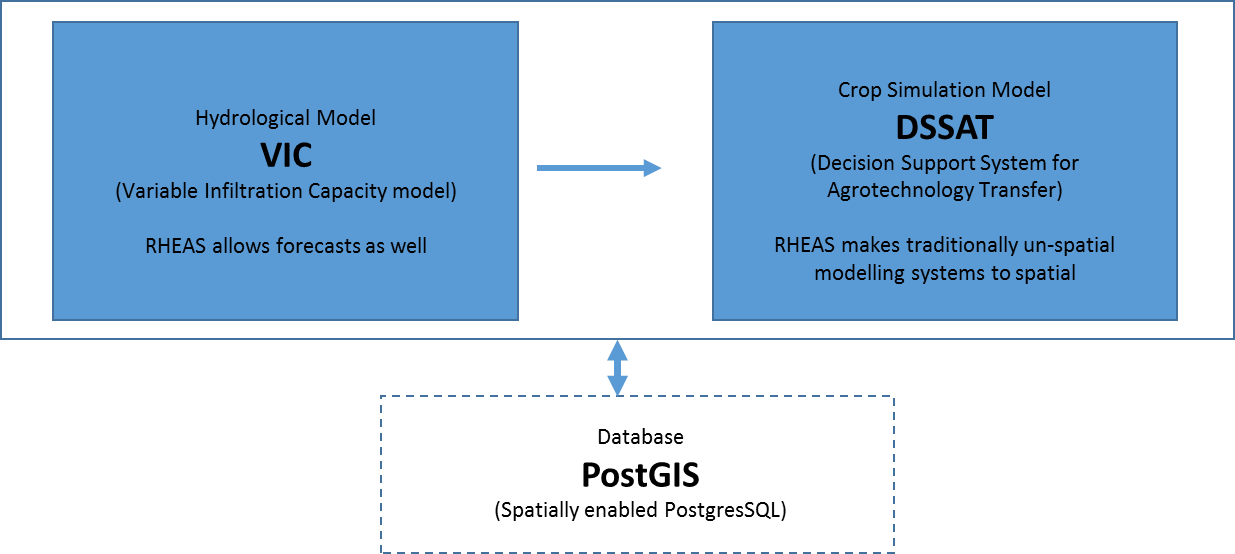
Fig 2: Modules of RHEAS Modeling Framework
- Outputs: describes the possible outputs from the system such as drought indices, other variables, maps, charts, etc. Details as below.
All map products are comprised with 25km spatial resolution and daily temporal resolution from 1981 up to date (nowcast) and 90-180 days ahead (forecast). All outputs would be automatically updated in every 14 days with latest available input data.
Interactive time series graphs are allowed user friendly temporal analysis.
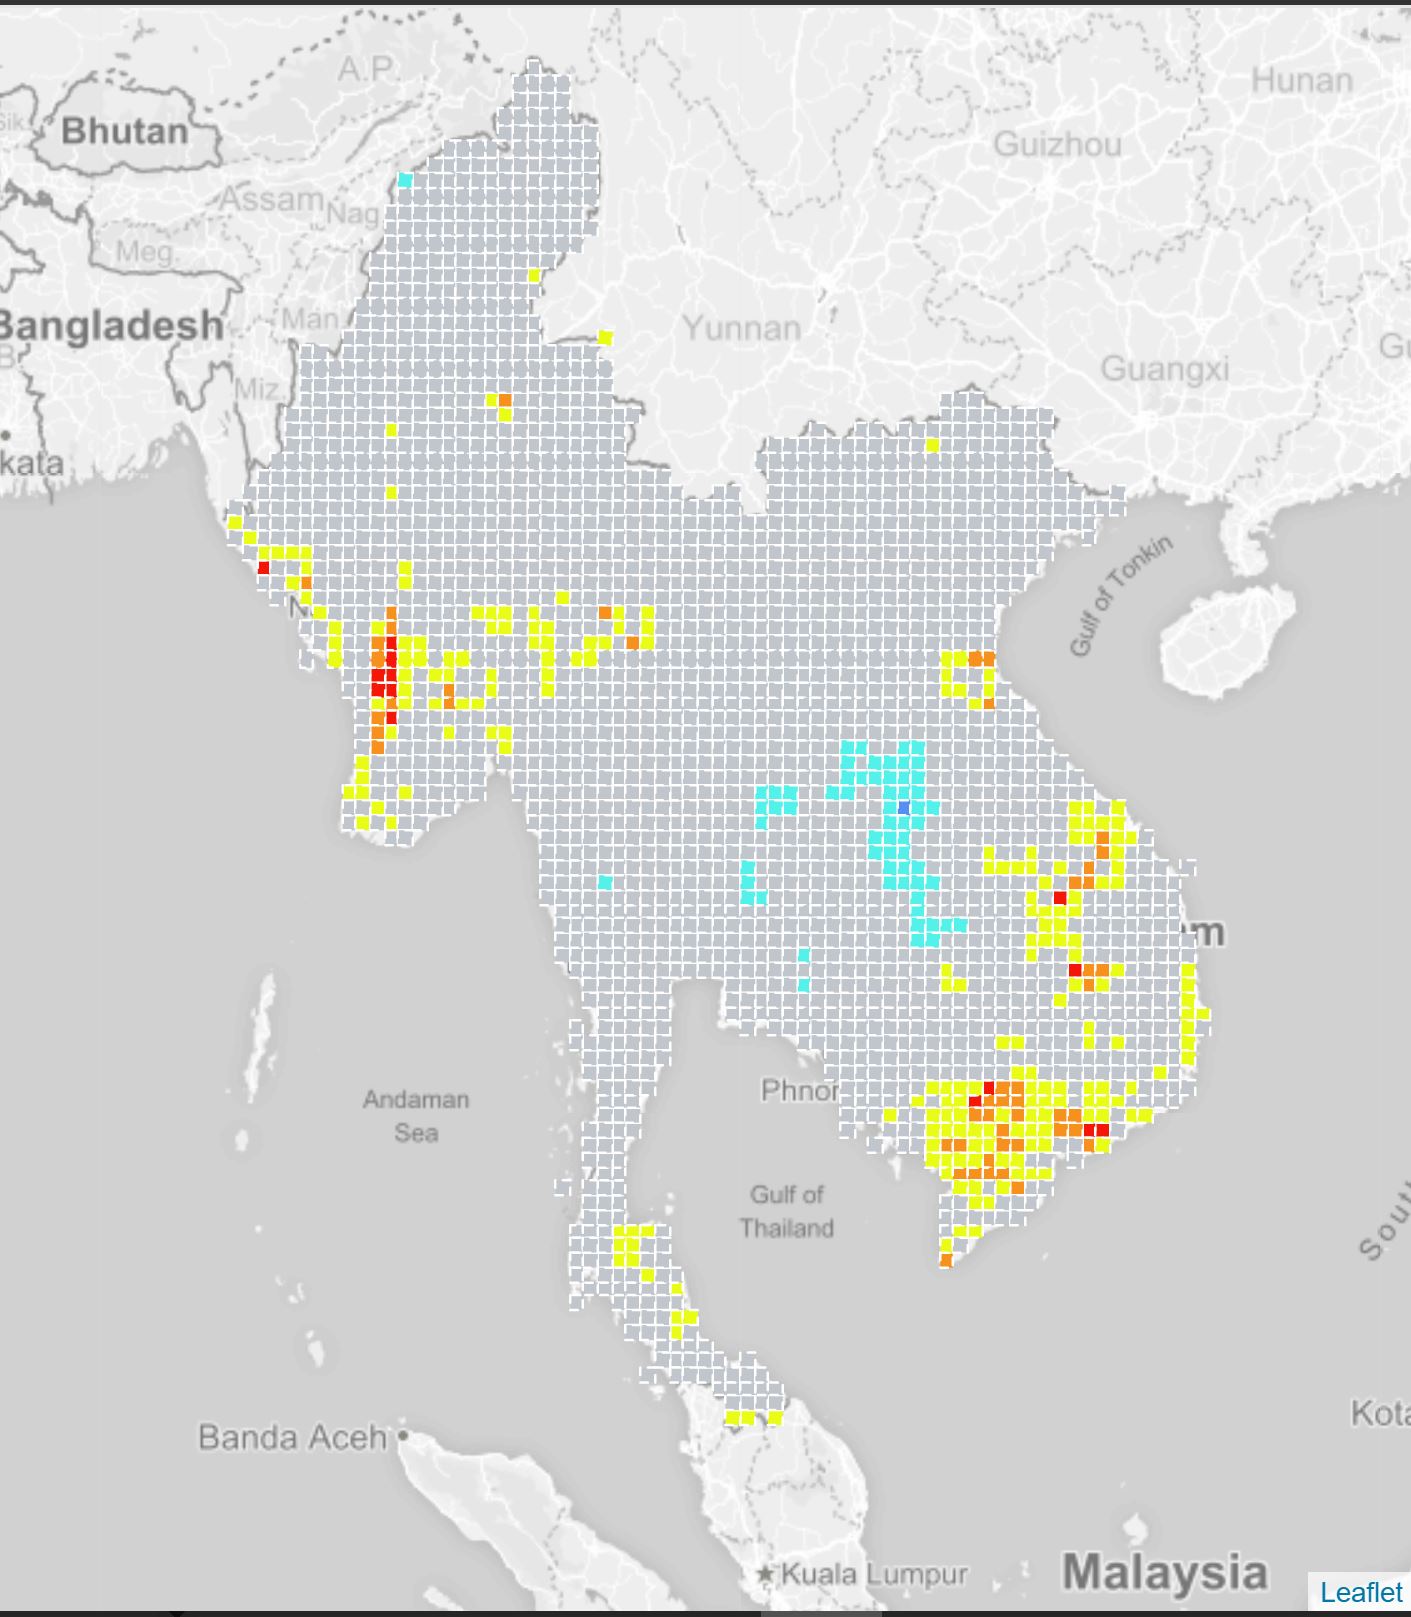
Fig 3: Spatial Map Outputs
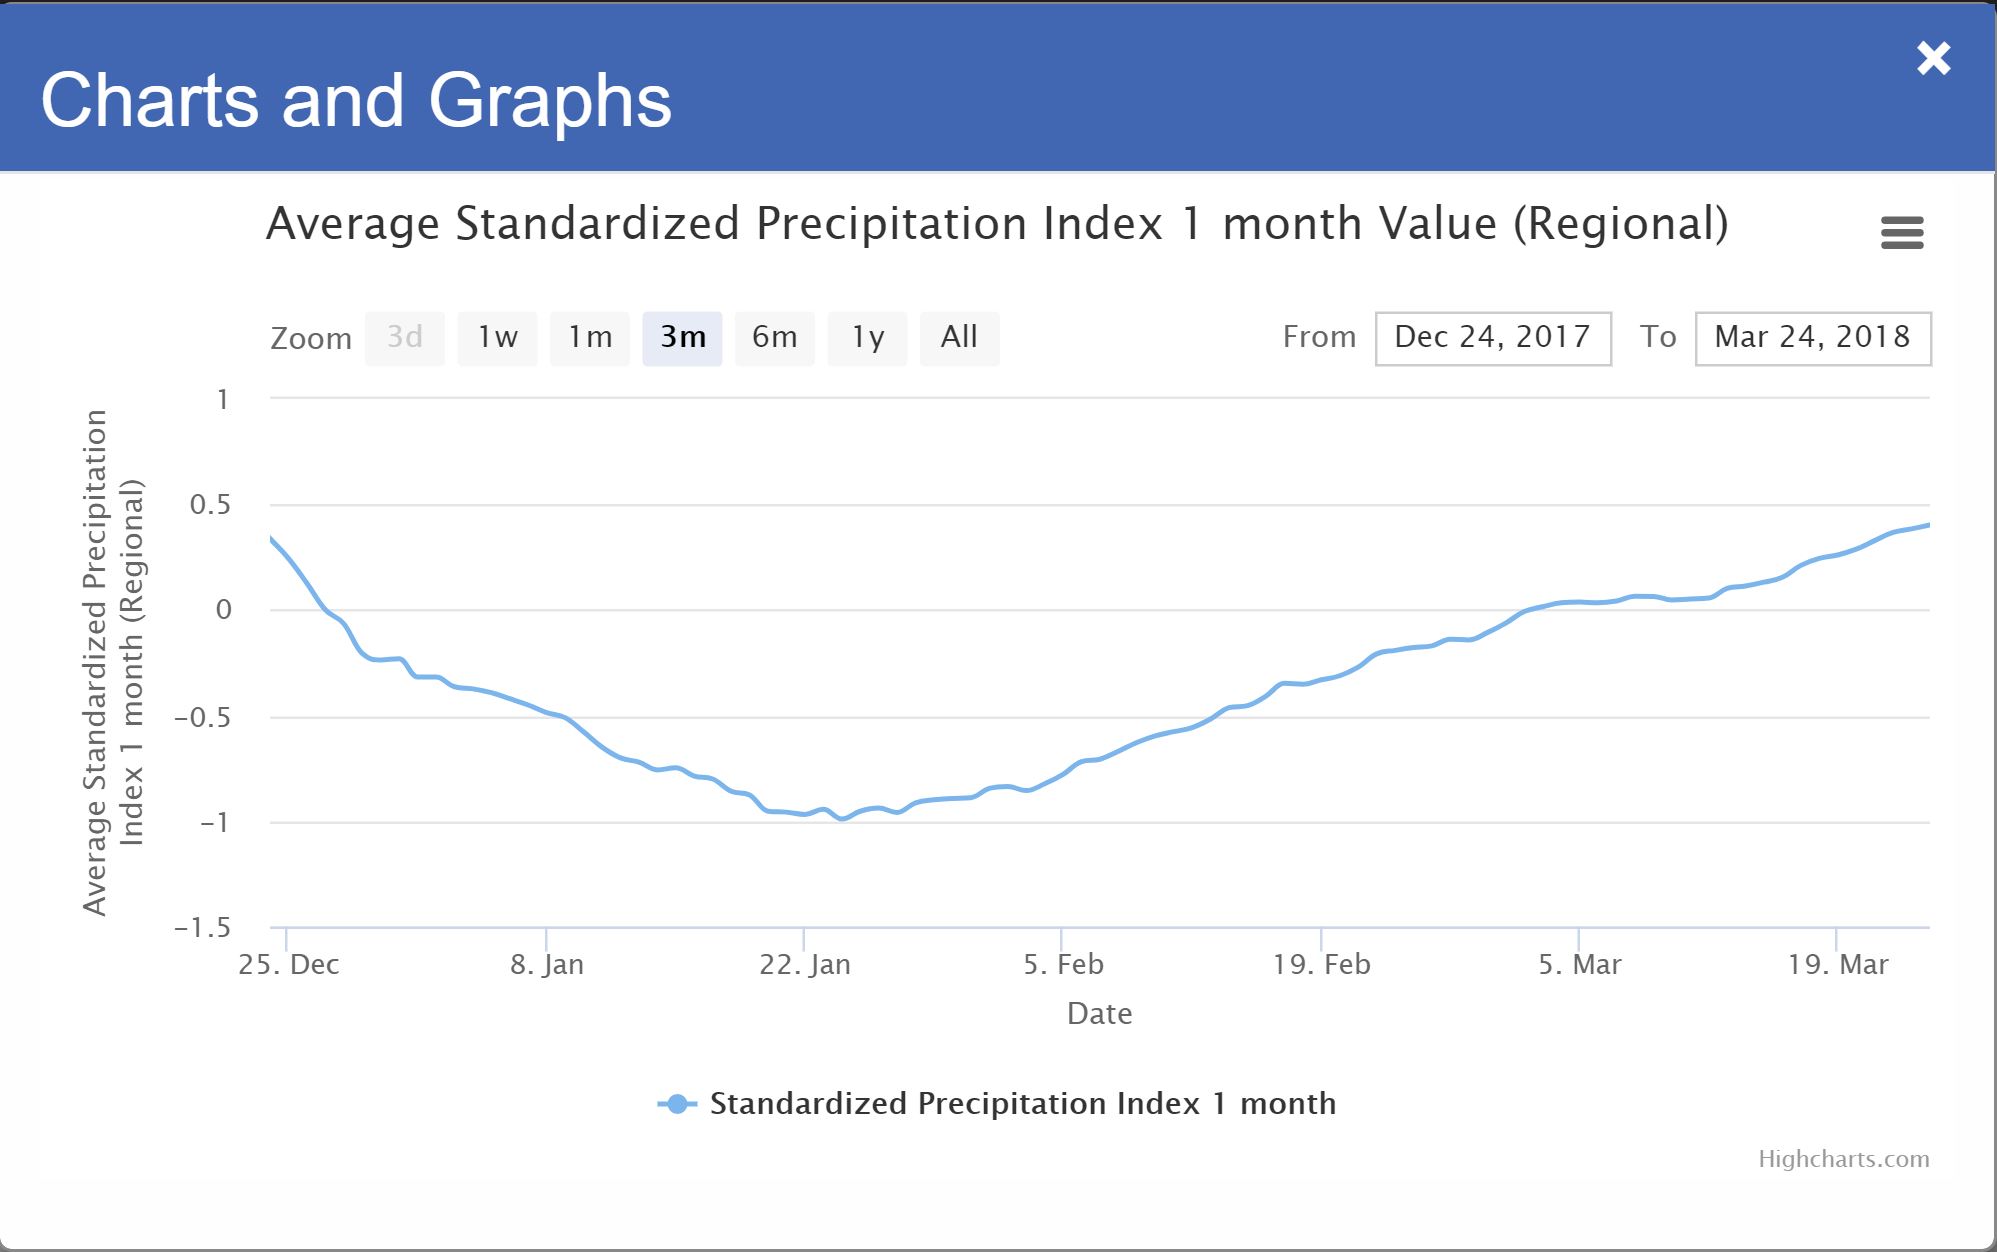
Fig 4: Time series graph Outputs
- Drought Indices:
- CDI: Combined Drought Index A,H
- SPI (1,3,6,12): Standardized Precipitation Index M
- SRI (1,3,6,12): Standardized Runoff Index H
- SMDI: Soil Moisture Deficit Index A
- Dry Spells: Number of dry spell events with at least 2-week duration A
- RZSM: Root Zone Soil Moisture A
- Drought Severity A
(A: suitable for agricultural droughts, H: suitable for hydrological droughts, M: suitable for meteorological droughts)
- Complementary Outputs: describes the secondary outputs which would be generated from the system.
- Soil Variables:
- Soil temperature for each soil layer
(3 layers: 0-10cm, 10-40cm and 40-100cm) - Soil total moisture content [mm] for each soil layer
(3 layers: 0-10cm, 10-40cm and 40-100cm)
- Energy Balance Variables:
- Surface temperature
- Net downward shortwave flux
- Net downward longwave flux
- Net upward latent heat flux
- Net upward sensible heat flux
- Net heat flux into ground
- Water Balance Variables:
- Baseflow
- Runoff
- Rainfall
- Total net evaporation
- Crop Yield Estimations:
- Maximum crop yield estimations for rice crop
- Maximum crop yield estimations for maize crop
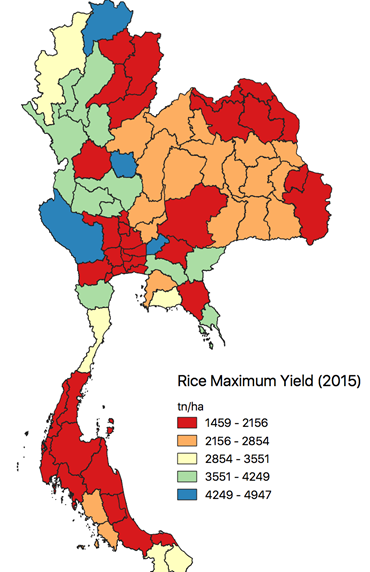
Fig 5: Map of Crop Yield Estimation
Details about all the indices and variables can be found from RDCYIS user guide: https://goo.gl/PMMgb4
- Web-based User Interface: Public mode of the RDCYIS is the user friendly interactive web based interface that is allowed the users to display, analyze and download the necessary drought and crop yield related information. Web-based online RDCYIS is available from https://rdcyis-servir.adpc.net.
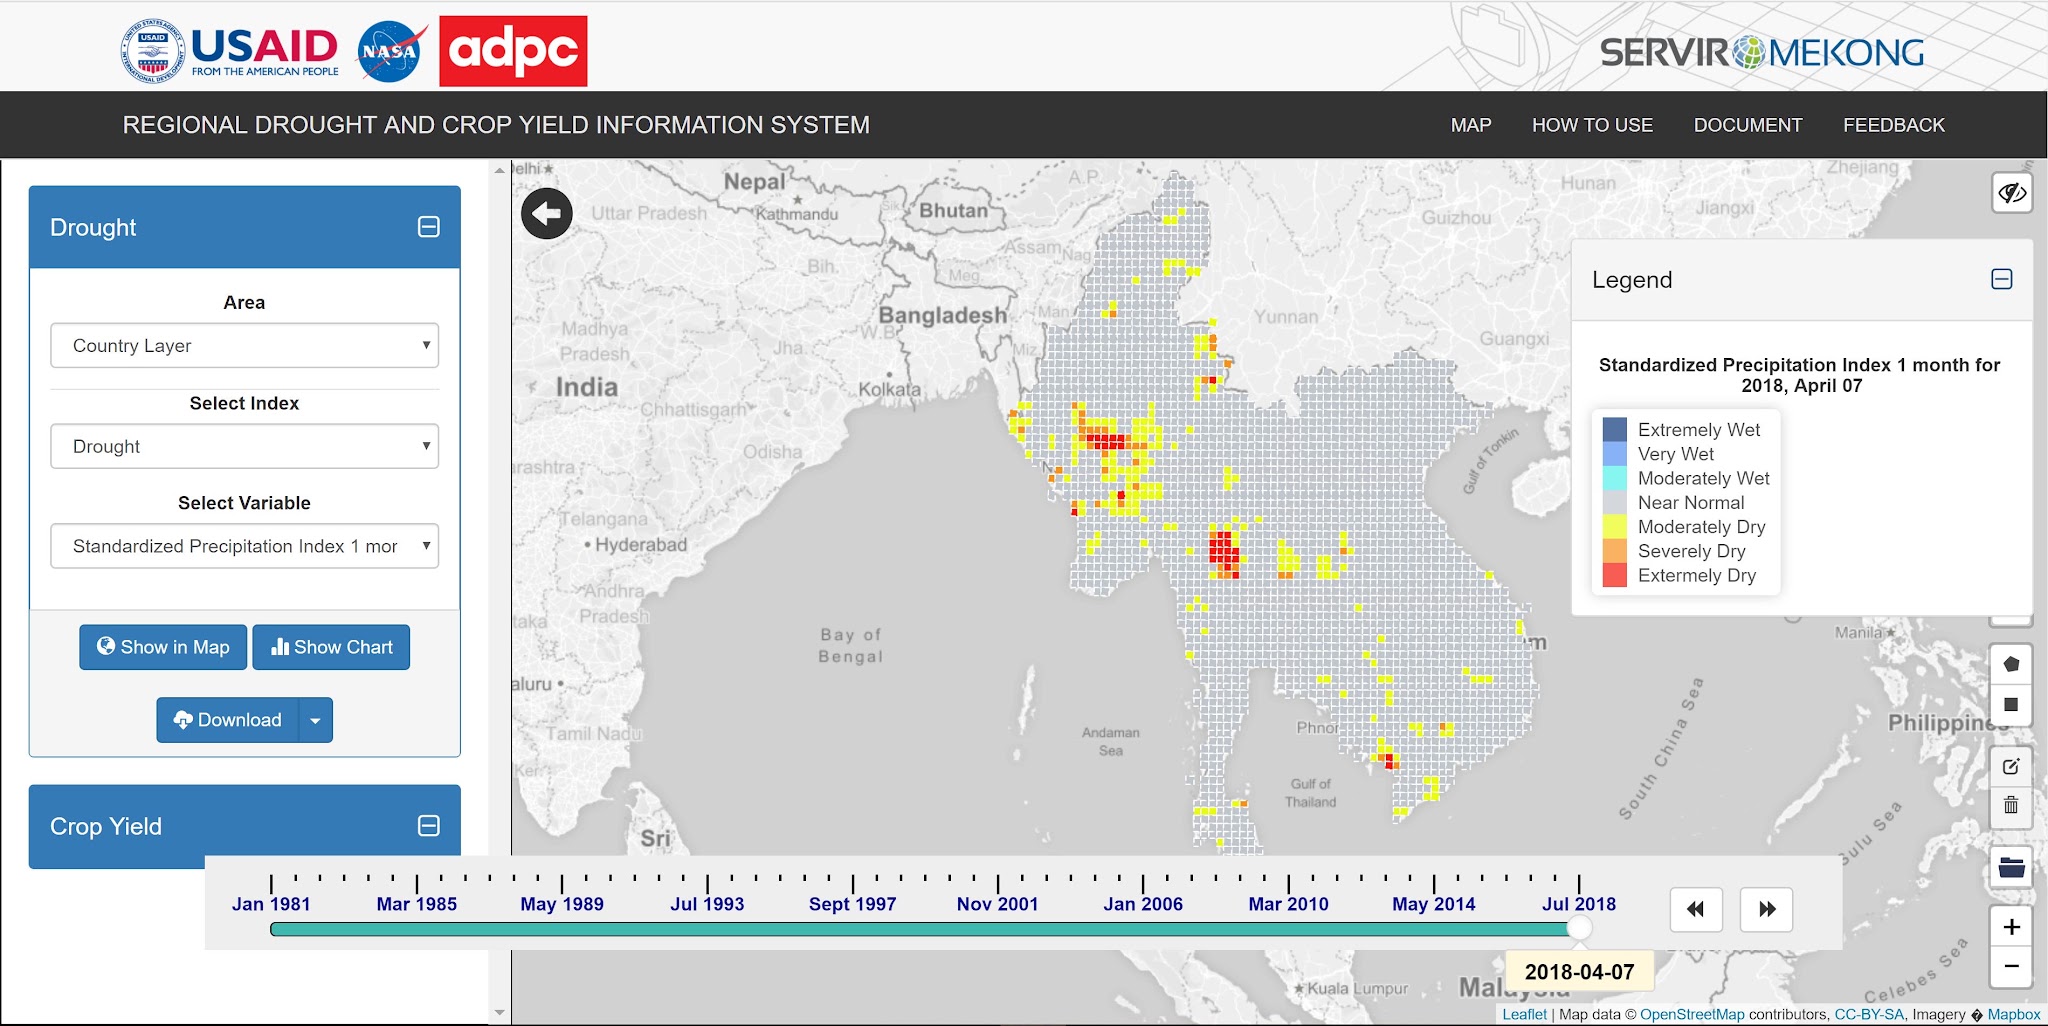
Fig 6: Web-based User Interface
Details descriptions about all the components of the user interface can be found from RDCYIS user guide: https://goo.gl/PMMgb4
- Decision Making: describes the use of RDCYIS for proper and comprehensive decision making to better prepare and respond to any drought condition by relevant government/non-government/regional agencies and individuals.
- Research: describes the use of RDCYIS for research activities by universities and research institutions.
Technical Inputs
- Established models / frameworks:
RHEAS modeling framework is fully deployed to power up the RDCYIS and it is generated the necessary products in automatic way every 14 days with latest available earth observation data. Forecast products are generated using Ensemble Streamflow Prediction (ESP) approach and using North American Multi-Model Ensemble (NMME) seasonal forecast information. Below is the nowcast and forecast configuration at SERVIR-Mekong to deploy the RHEAS. To improve the outputs products of RHEAS, soil moisture data assimilation keeps always on and 15 ensemble runs will be generated.
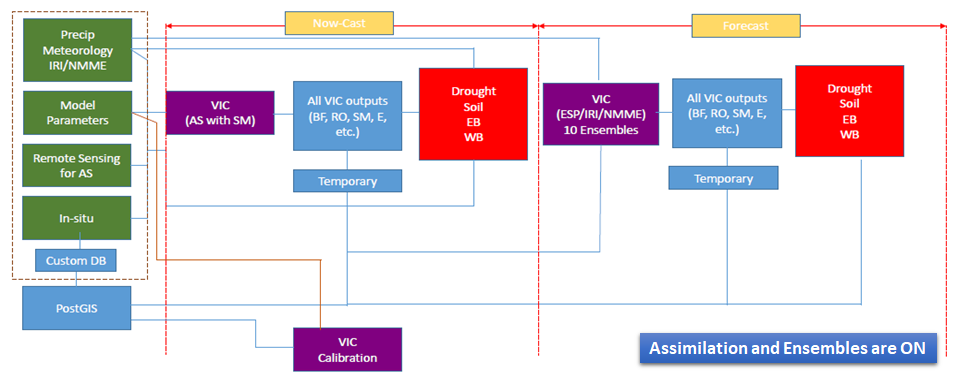
(AS: Assimilation, SM: Soil moisture; BF: Base Flow; RO: Runoff; E: Evaporation; EB: Energy Balance; WB: Water Balance; ESP: Ensemble Streamflow Prediction; NMME: North American Multi-Model Ensemble)
Fig 7: Nowcast and Forecast Configuration of RHEAS
Data Inputs
Below set of input data has been selected to feed into the RHEAS modeling framework operationally after conducting many sensitivity analysis.
Variable | Dataset | Tim. Cov. | Temp. Res | Spat. Res | Spatial Coverage | Table | Mode |
Precipitation | CHIRPS | 1981- | Daily | 5km | LMR | precip.chirps | IN |
Temp/Wind | NCEP | 1981- | Daily | 1.875o | LMR | *.ncep | IN |
Soil moisture | SMOS | 2009- | Daily | ~40km | LMR | soilm.smos | AS |
Soil moisture | SMAP | 2015- | Daily | ~9km | LMR | soilm.smos | AS |
Meteorology | NMME | 2000- | Daily | 50km | LMR | *.nmme | FC |
Table 3: Selected Input Data for Ingesting to the RHEAS Model
Calibration/Validation
- Steps to calibrate and validate VIC model within RHEAS framework using the soil moisture data
Some notes:
- RHEAS mainly focuses on meteorological and agricultural droughts.
- VIC model within RHEAS is more purposed to generate soil moisture and ET (for drought indices and to feed into crop productivity model DSSAT)
- VIC cannot take into consideration the human interventions of the basin. Generally, most of the basins in LMR have been heavily affected by human interventions. Therefore, calibrating VIC within RHEAS using streamflow is bit complex. Because of this, soil moisture is considered as the main variable to be calibrated over the LMR domain.
- Calibration with streamflow data is not considered as relevant for this application due to the above mentioned points. VIC calibration for whole LMR will take the advantage of existing calibration efforts in the region (e.g. VRSG).
- Calibrations will deploy Pedo-transfer Functions (PTF) mechanism to calibrate the rest of the area wrt existing calibrated area/basin.
Calibration Steps: [RHEAS Detailed Calibration Process].
- Calibrated soil parameters for the Mekong River Basin, which is also a subset area of LMR, will be used. The Mekong River Basin intersects geographically with 4 of the 5 countries in the LMR. i.e Lao PDR, Thailand, Cambodia and Vietnam. For this study, the calibrated model parameters are collected from the VIC model implemented by Faisal, Lee, et al (2016). [Report is available here]
- Soil parameters for the VIC model (b_infilt, Ds, Ws, Dsmax, and soil depth) have been substantially calibrated using streamflow observations over the Mekong basin by Faisal, Lee, et al (2016). Soil data has been taken from the Harmonized Land database at 12.5km resolution. The input forcing for the model were from GSOD of NCDC for that study.
- Replace existing soil data points in the soil file used by RHEAS with calibrated soil points. (replaced with nearest calibrated point).
- Assume that this subset of calibrated VIC parameters is capable to represent most of the available spatial locations within the study domain (LMR).
- To effectively use the subset of calibrated VIC parameters, we need to identify optimal number of pedo-transfer functions. The pedo-transfer functions are selected for this study that generally influence the evolution of calibrated VIC parameters related to land/soil are: % sand, %clay, DEM, Bulk density, Landuse/Land Cover and LAI.
- Perform grouping analysis using the above mentioned pedo-transfer function to both Mekong River Basin area and the whole study area (LMR) to identify the areas that have similar geophysical characteristics.
- Use trial and error method to identify total number of clusters (i.e. 10 to 40).
- Identify clusters in the LMR similar to Mekong River Basin.
- Assign calibrated soil parameters to each cluster accordingly based on the calibrated soil parameters in Mekong basin.
- Use the new parameter file as an input to the RHEAS model and to generate surface soil moisture maps. Model would be executed for the period 2005 Jan – 2016 Dec (10-year period). RHEAS would be executed as open loop run (without any assimilation).
- Validation: An independent source of soil moisture information is needed for validation. In this case, we found SMOS/SMAP data that has high temporal and spatial continuity can be used for validation of the parameters. Below table is summarized the performance of RHEAS generated soil moisture with compared to SMAP satellite products. Expected correlation is about 75%.
Month | Correlation | NSE | Month | Correlation | NSE | |
Jan-2015 | - | - | Jan-2016 | 0.78 | 0.5 | |
Feb-2015 | - | - | Feb-2016 | 0.76 | 0.5 | |
Mar-2015 | - | - | Mar-2016 | 0.81 | 0.6 | |
Apr-2015 | 0.79 | 0.5 | Apr-2016 | 0.78 | 0.5 | |
May-2015 | 0.79 | 0.5 | May-2016 | 0.79 | 0.5 | |
Jun-2015 | 0.75 | 0.4 | Jun-2016 | 0.76 | 0.4 | |
Jul-2015 | 0.74 | 0.4 | Jul-2016 | 0.75 | 0.4 | |
Aug-2015 | 0.74 | 0.4 | Aug-2016 | 0.76 | 0.4 | |
Sep-2015 | 0.76 | 0.5 | Sep-2016 | 0.77 | 0.5 | |
Oct-2015 | 0.79 | 0.5 | Oct-2016 | 0.79 | 0.5 | |
Nov-2015 | 0.78 | 0.5 | Nov-2016 | 0.79 | 0.5 | |
Dec-2015 | 0.80 | 0.6 | Dec-2016 | 0.81 | 0.6 |
Table 4: Product Validation, Comparison of Soil Moisture products of RHEAS and SMAP
The products were further validated using Global Land Data Assimilation System (GLDAS). GLDAS ingests satellite and ground-based observational data products. Using advanced land surface modeling and data assimilation techniques, it generates optimal fields of land surface states and fluxes. GLDAS-2.0 is one of two components of the GLDAS Version 2 (GLDAS-2) data set, the second being GLDAS-2.1. GLDAS-2.0 is reprocessed with the updated Princeton meteorological forcing data set and upgraded Land Information System Version 7 (LIS-7). It covers the period 1948-2010, and is likely to be further extended to more recent years as corresponding forcing data becomes available. The forcing dataset contains many bands similar to RHEAS produce.
RHEAS and GLDAS Output Comparisons:
The RHEAS soil moisture outputs had been validated from soil moisture outputs derived from GLDAS assuming that GLDAS outputs are accurate.
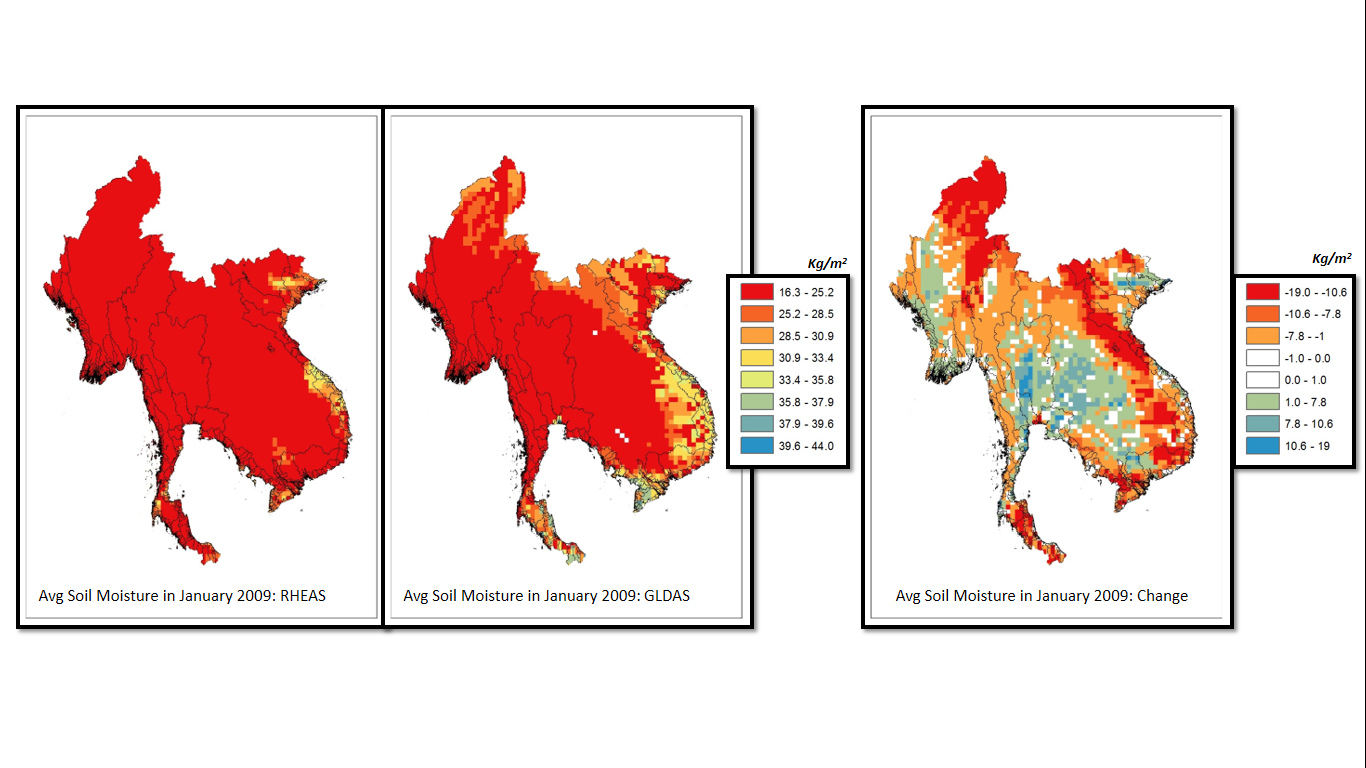
Fig 8: Comparison of RHEAS and GLADS Soil Moisture Products
The difference map was generated and soil moisture outputs observed and assessed. Although the results from RHEAS does not match exactly with GLDAS, however, not much variations can be seen from the outputs giving an indication that configuration of RHEAS is reliable and the system is robust in its performance.
Development of Web-based User Interface
Below flow diagrams are depicted the approach for developing the web-based user interface for RDCYIS. It has been trying to use open-source software and tools as much as possible for easy replications. All the source codes are freely available in SERVIR GitHub page (https://github.com/Servir-Mekong/Drought-And-Crop-Yield).

Selecting most updated product Calling forecast product


Fig 9: Approach of Developing Web-based tool for RDCYIS
Key Functions and Outputs
- Easy access and visualize of daily historical, present and future
- drought related conditions across the Lower Mekong Region
- crop yield estimations across the Lower Mekong Region
- The data is updated every two weeks
- Availability of variety of data-based drought indices and indicators and a single composite drought indicator
- Availability of variety of soil, water balance and energy balance variables
- More convenient access to data products
- Regional level focused high-resolution information that can be used in local level decisions
- Country level, Different admin level and Custom areas of selections
- Ability to upload user’s interest areas
- Generation of flexible time-series charts
- Download the map data in GIS formats
- Detailed guidance on using data streams for conditions monitoring and forecasting
Limitations
Crop yield estimations are currently not available.
Current expected accuracy is about 75%
There could be uncalculated products for some dates due to data and model inconsistency.
Product resolution is 25km and not much suitable for smaller area decision making.
Combined Drought Index (CDI) is still in experimental mode.
Time series graphs will only generated in regional scale.
Basic statistics calculation is not available.
Local level conditions are not well integrated to the system and it is advised to take into consideration local knowledge before taking any decision based on the available products in the RDCYIS.
Gender considerations
- Women and men’s relationship with climate sensitive variables such as environment, agriculture, food security, is differentiated based on their roles with these variables;
- Drought affects men, women, girls and boys in different ways because their livelihood and household roles and responsibilities are different;
- Drought information can be analyzed in gender-disaggregated ways: by tracking the effects of drought on water-related livelihood tasks and household obligations of women and men;
- Women are typically more affected by drought because it is their job to find water and food for the family;
- Workloads of women and girls increase, walking long distances to fetch water, exposing them to risks, whereas men migrate to far off places for possible non-farm work;
- Take gender-conscious steps to reduce the negative impacts of droughts on women, particularly in relation to their critical roles in rural areas in provision of water, food and energy; this can be done at the planning level, where conscious effort should be made to integrate gender perspectives Increase the participation of women at all levels of the decision-making process, specifically by ensuring that these organizations (and their concerns) are represented when drought decision support tools are being developed and finalized ;
- Identify key women at local levels to guarantee that gender perspectives are considered when preparing early warning mechanisms with relation to droughts;
- Determine women and men’s significant contributions to the adaptive capacity of households during drought periods when resources such as livelihoods gets stressed;
- Promote gender equity in interventions to improve women’s access and control over information, capital, water and land resources that may make them resilient to drought and dry spells;
- Gender-conscious policy interventions and decision making on drought management would be essential both at the program and planning levels with the view to mainstream gender issues through a consciousness of how drought impacts are gender-specific.
Next Steps/Conclusion
Next version of the tool would mainly focused to address existing limitations and to improve the user experience by adding new features and improved products. Furthermore, ongoing user engagement feedback will go into future improvements.
- Implement existing PostGIS database in Data Cube approach
- Generate time series graphs for user’s Area of Interests (AOIs)
- Add statistics calculation
- Include crop yield information for maize and rice crops
- Increase output data resolution to 5km
- Add customized and new indices/variables
- Include climate projections data
- Add Text bulletins
Appendices
Appendix 1
Technical Descriptions of Variable Calculation
This document provides detailed technical information of calculation of variables that are used in RDCYIS. https://goo.gl/mQtcVS
Appendix 2
Technical Descriptions of Drought Indices
This ‘Handbook of Drought Indicators and Indices’ is provided comprehensive information about different drought indices. http://library.wmo.int/pmb_ged/wmo_1173_en.pdf
Regional Drought and Crop Yield Information System (RDCYIS) Page of